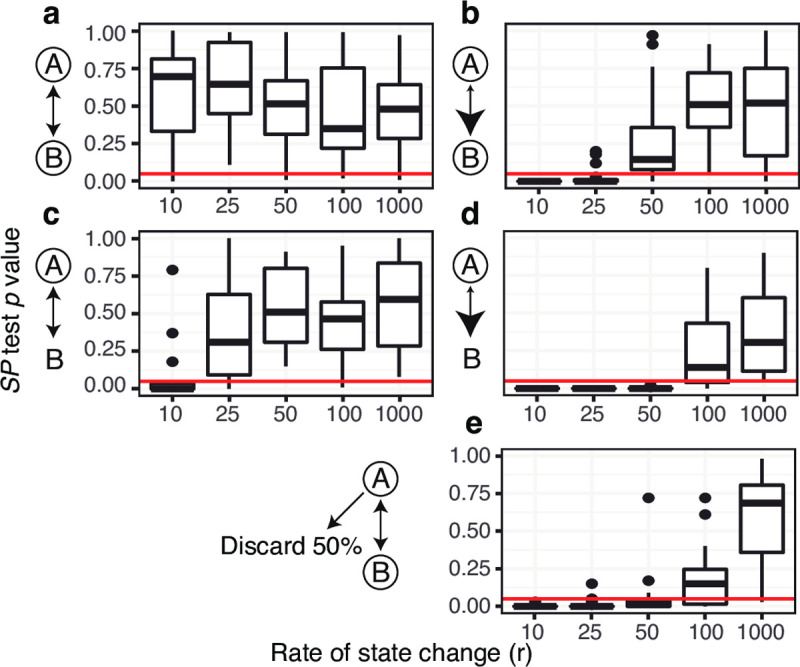
Fig 2. Distribution of SP test p values from A to B from two state simulation analyses in which state change between state A and B was determined by the probability of starting in A (πa), relative rate of migrating from A to B (rab), and the average rate of state change (r).

To the left of each plot, possible starting states are circled, relative rates are shown by arrowhead size. (a) πa = 0.5, rab = 1, fully unbiased state change, shows roughly uniform distribution of p values at all tested rates. (b) πa = 0.5, rab = 10 shows low p values at rates < 50. (c) πa = 1, rab = 1 shows low p values at low rates (10) but not at higher rates. (d) πa = 1, and rab = 10 shows low p values at rates < 100. (e) πA = 0.5, rab = 1 shows low p values at rate < 50 if 50% of A sequences are discarded. Compared to (a), this shows that p values are sensitive to biased sampling of sequences. Red lines show the cutoff of p value = 0.05.
