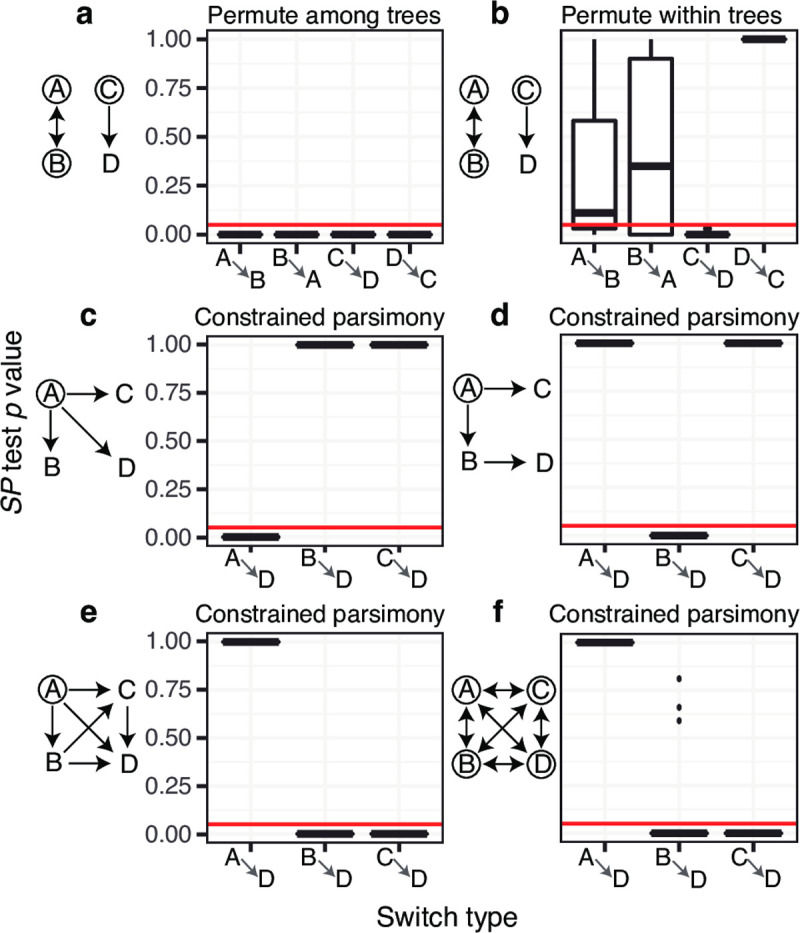
Fig 3. Distribution of SP test p values from four state simulation analyses under multiple modes of evolution diagrammed to the left of each plot.

Twenty repetitions were performed in each scenario. In simulations, possible starting states are circled and possible state changes are shown with arrows. All allowed state changes occurred at the same relative rate and the total rate of state change (r) was 10 changes/mutation/site (see Fig 2). (a) Permuting trait values among trees reveals low p values for all state changes between A and B, and between C and D. (b) Permuting within each tree reveals low p values from C to D, but not between A and B. Both a and b imposed no constraints on the types of state changes allowed in the maximum parsimony algorithm. (c) Direct switching simulations result in low p values from A to D, but not from other states to D. (d) Sequential switching simulations result in low p values from B to D but not from other states to D. (e) Irreversible switching simulations result in low p values from B and C to D, but not from A. (f) Unconstrained switching simulations also result in low p values from B and C to D, but not from A. The strange results of e and f are likely artefacts of the constrained parsimony algorithm, which forbids reverse alphabetical state changes (e.g. D to C), used to count state changes in simulations c-d.
