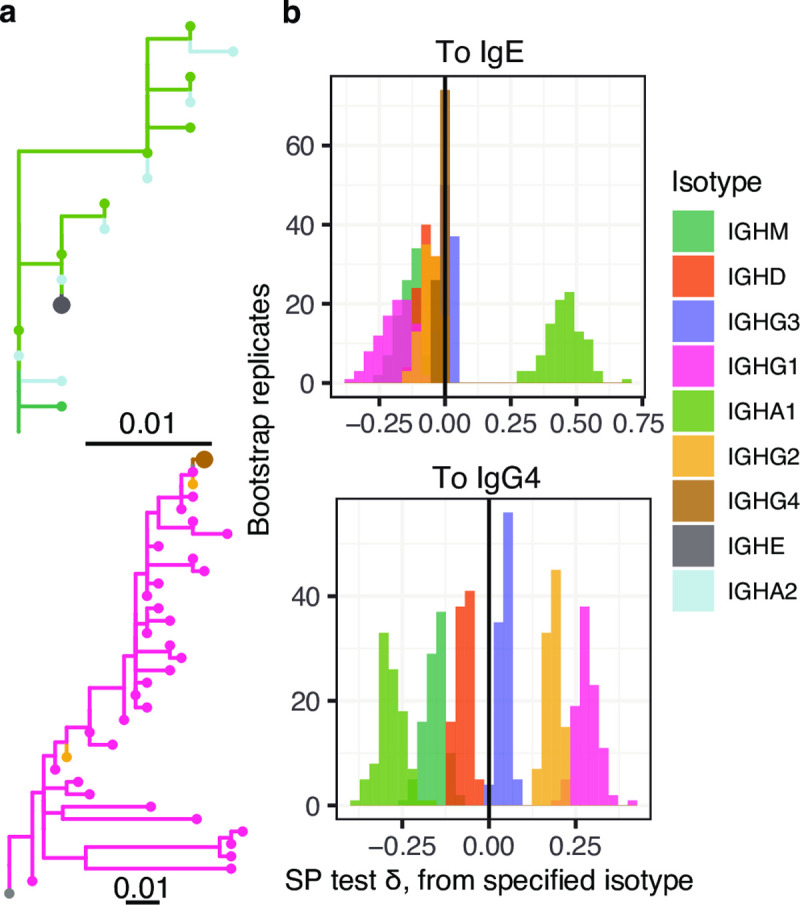
Fig 6. Analysis of antibody isotypes from a single subject.

(a) Example trees visualized using ggtree [38,39] showing observed relationships between cells expressing BCRs with IgA1 and IgE, as well as IgG1 and IgG4 isotypes. IgE and IgG4 are indicated on each tree using larger tip circles. (b) Distribution of SP test δ values to IgE from each of the other isotypes (different colors), and distribution of SP test δ values to IgG4 from each of the other isotypes (different colors). State changes in b were calculated using constrained parsimony which forbids state changes that violate the geometry of the Ig heavy chain locus, and SP tests were performed using permutation among trees.
