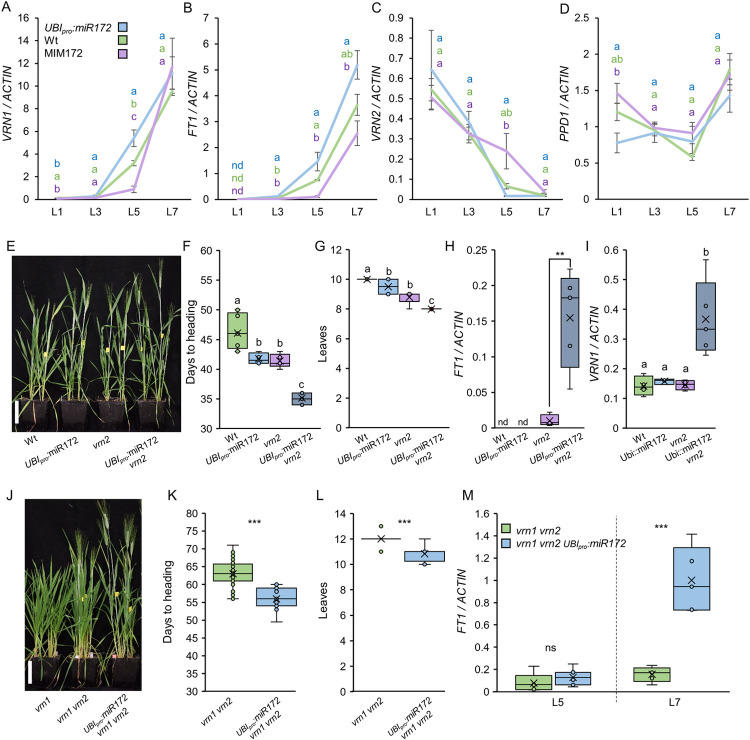
Fig 2. miR172 controls flowering through the regulation of FT1 expression in leaves.
(A-D) Expression levels of VRN1 (A), FT1 (B), VRN2 (C), and PPD1 (D) determined by qRT-PCR in the 1st (L1), 3rd (L3), 5th (L5) and 7th (L7) leaves of UBIpro:miR172, wild type Kronos (Wt) and MIM172 plants grown under LD. ACTIN was used as internal reference. Data correspond to four independent biological replicates. (E-I) Population segregating for wild type Kronos (Wt), UBIpro:miR172, vrn2 and UBIpro:miR172 vrn2 plants grown under LD. (E) Six-week-old plants. Scale bar = 10 cm. (F-G) Box plots showing days to heading (F; n ≥ 4) and total number of leaves produced by the main tiller (G; n ≥ 4). (H-I) Box plots showing FT1 (H) and VRN1 (I) expression levels determined by qRT-PCR in the first leaves. ACTIN was used as internal reference. Data correspond to four independent biological replicates. (J) Nine-week-old vrn1 null, vrn1 vrn2 combined mutant and vrn1 vrn2 UBIpro:miR172 plants growing under LD. Scale bar = 10 cm. (K-M) vrn1 vrn2 combined mutant and vrn1 vrn2 UBIpro:miR172 plants grown under LD. (K-L) Box plots showing days to heading (K; n ≥ 11) and number of leaves produced by the main tiller (L; n ≥ 12). (M) Box plots showing FT1 expression levels determined by qRT-PCR in the 5th (L5) and 7th (L7) leaves. ACTIN was used as internal reference. Data correspond to five independent biological replicates. Different letters above the box plots indicate significant differences based on Tukey tests (P < 0.05) in panels (A-D), (F) and (I), on Kruskal-Wallis non-parametric testes in (G) and (L), and on t-tests in panels (H), (K) and (M) (Data B in S1 Data). ns = not significant, * = P < 0.05, ** = P < 0.01, *** = P < 0.001. The color of the letters in A-D correspond to the color of the genotypes.

