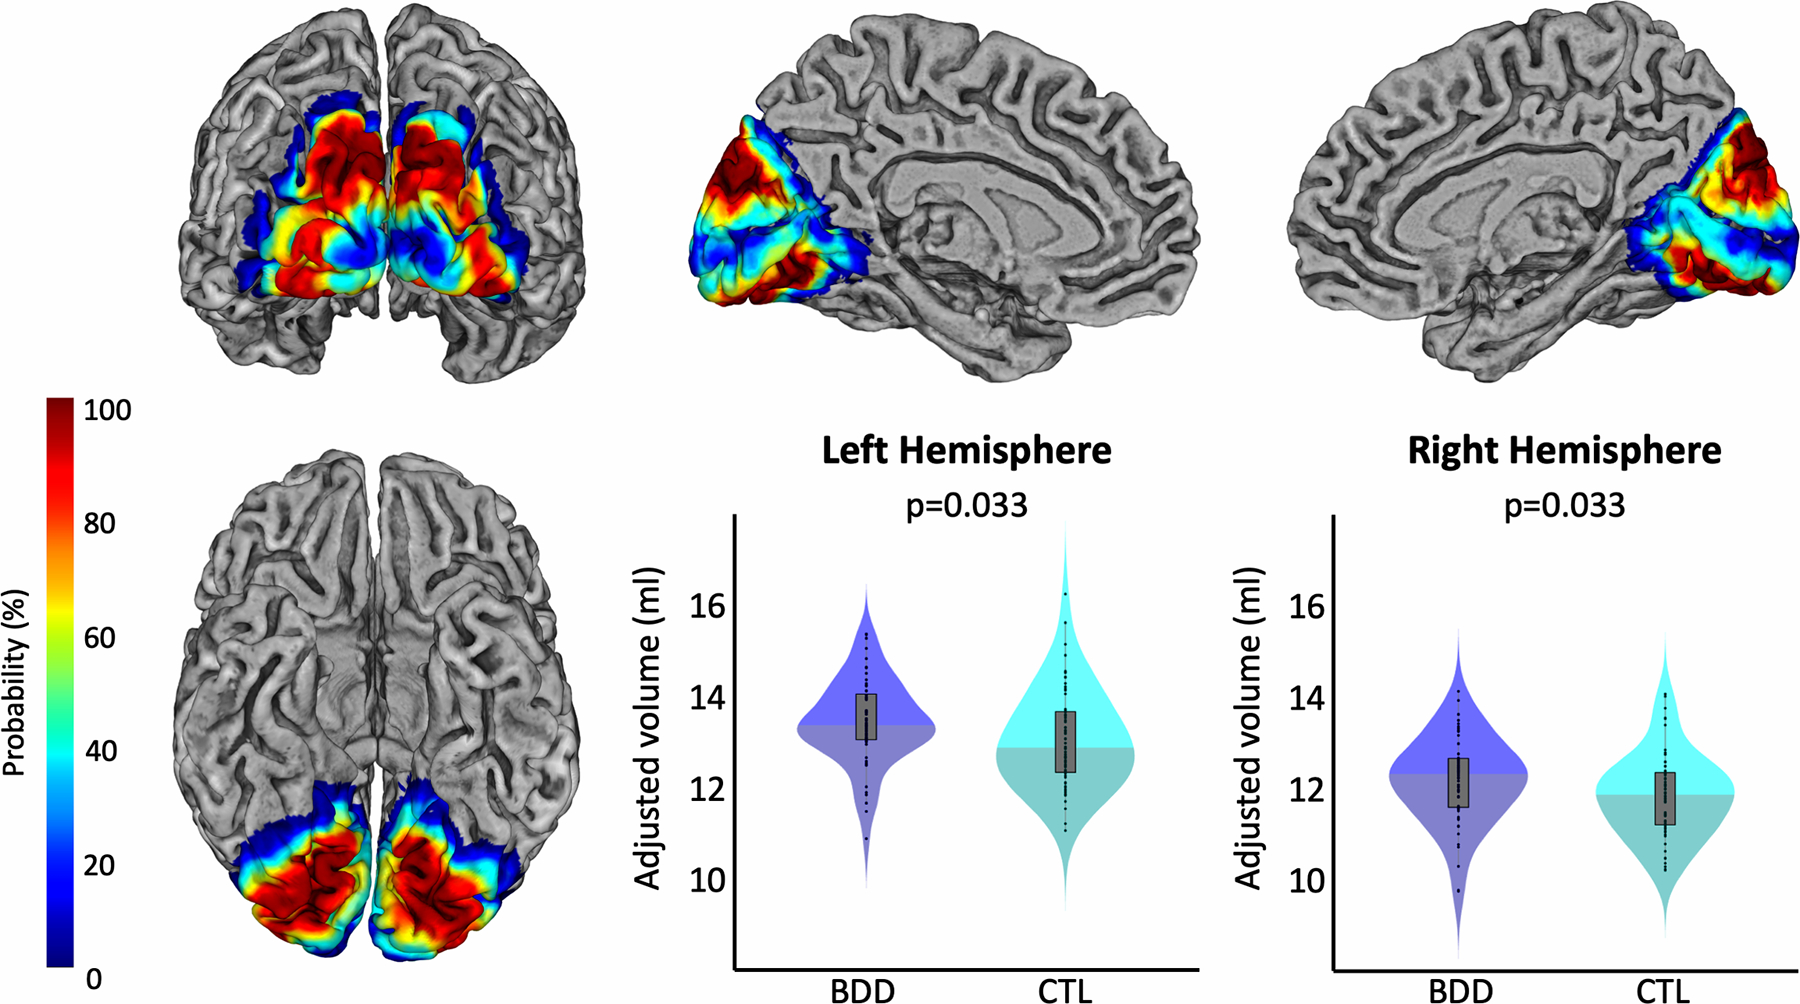
Figure 1.

Group differences in the gray matter volume of the early extrastriate cortex. The renderings depict the local probability of each voxel to belong to any of the regions of interest. The left column shows a view of the ROI from occipital (top) and inferior (bottom). The top row further shows views of the ROI of the left medial (middle) and right medial hemisphere (right). The violin plots present the respective gray matter volumes within this region in blue for participants with BDD and in cyan for controls. Left hemispheric volumes are shown in the middle and right hemispheric volumes on the right of the bottom row. All gray matter volumes are adjusted for age, sex, total intracranial volume, years of education, and scanner. Significance values are corrected for multiple comparisons.
