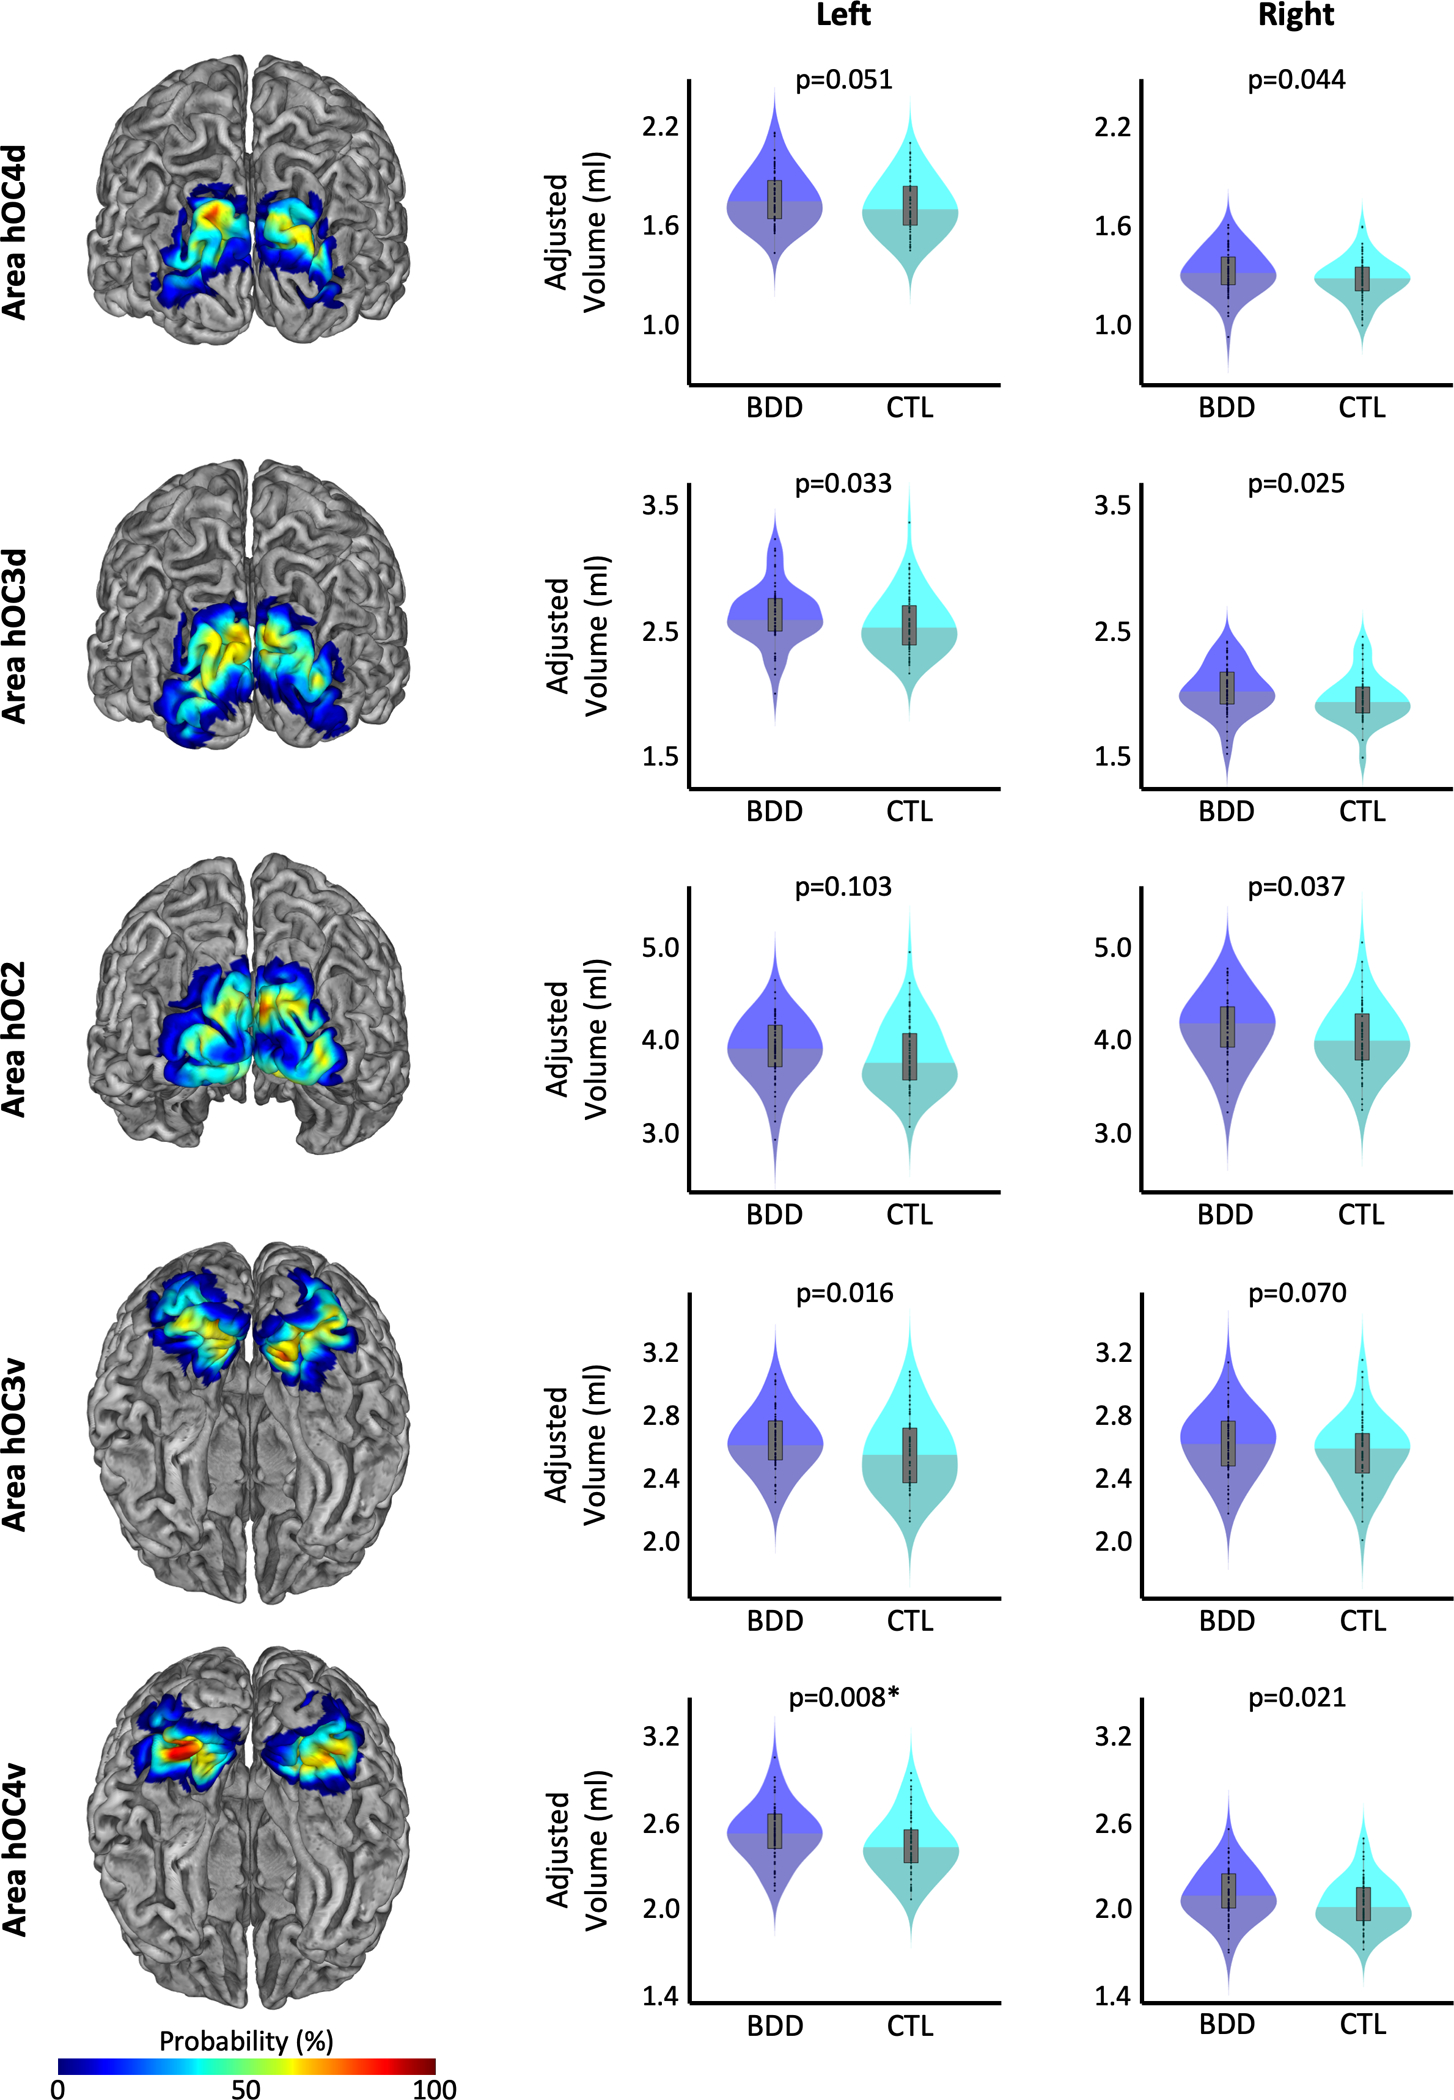
Figure 3.

Group differences in regional gray matter volumes. Probabilistic maps of the cytoarchitectonic regions of the early extrastriate cortex, which served as the regions of interest, are depicted on the left with a posterior view (top three) or inferior view (bottom two). The respective violin plots of the gray matter volumes in participants with BDD (shown in blue) and controls (shown in cyan) are depicted in the middle for the left hemisphere and the right for the right hemisphere. All gray matter volumes are adjusted for age, sex, total intracranial volume, years of education, and scanner. The asterisk indicates the group difference that survived correction for multiple comparisons.
