
Figure 3: Regularized classification results for the mfeat digits dataset.
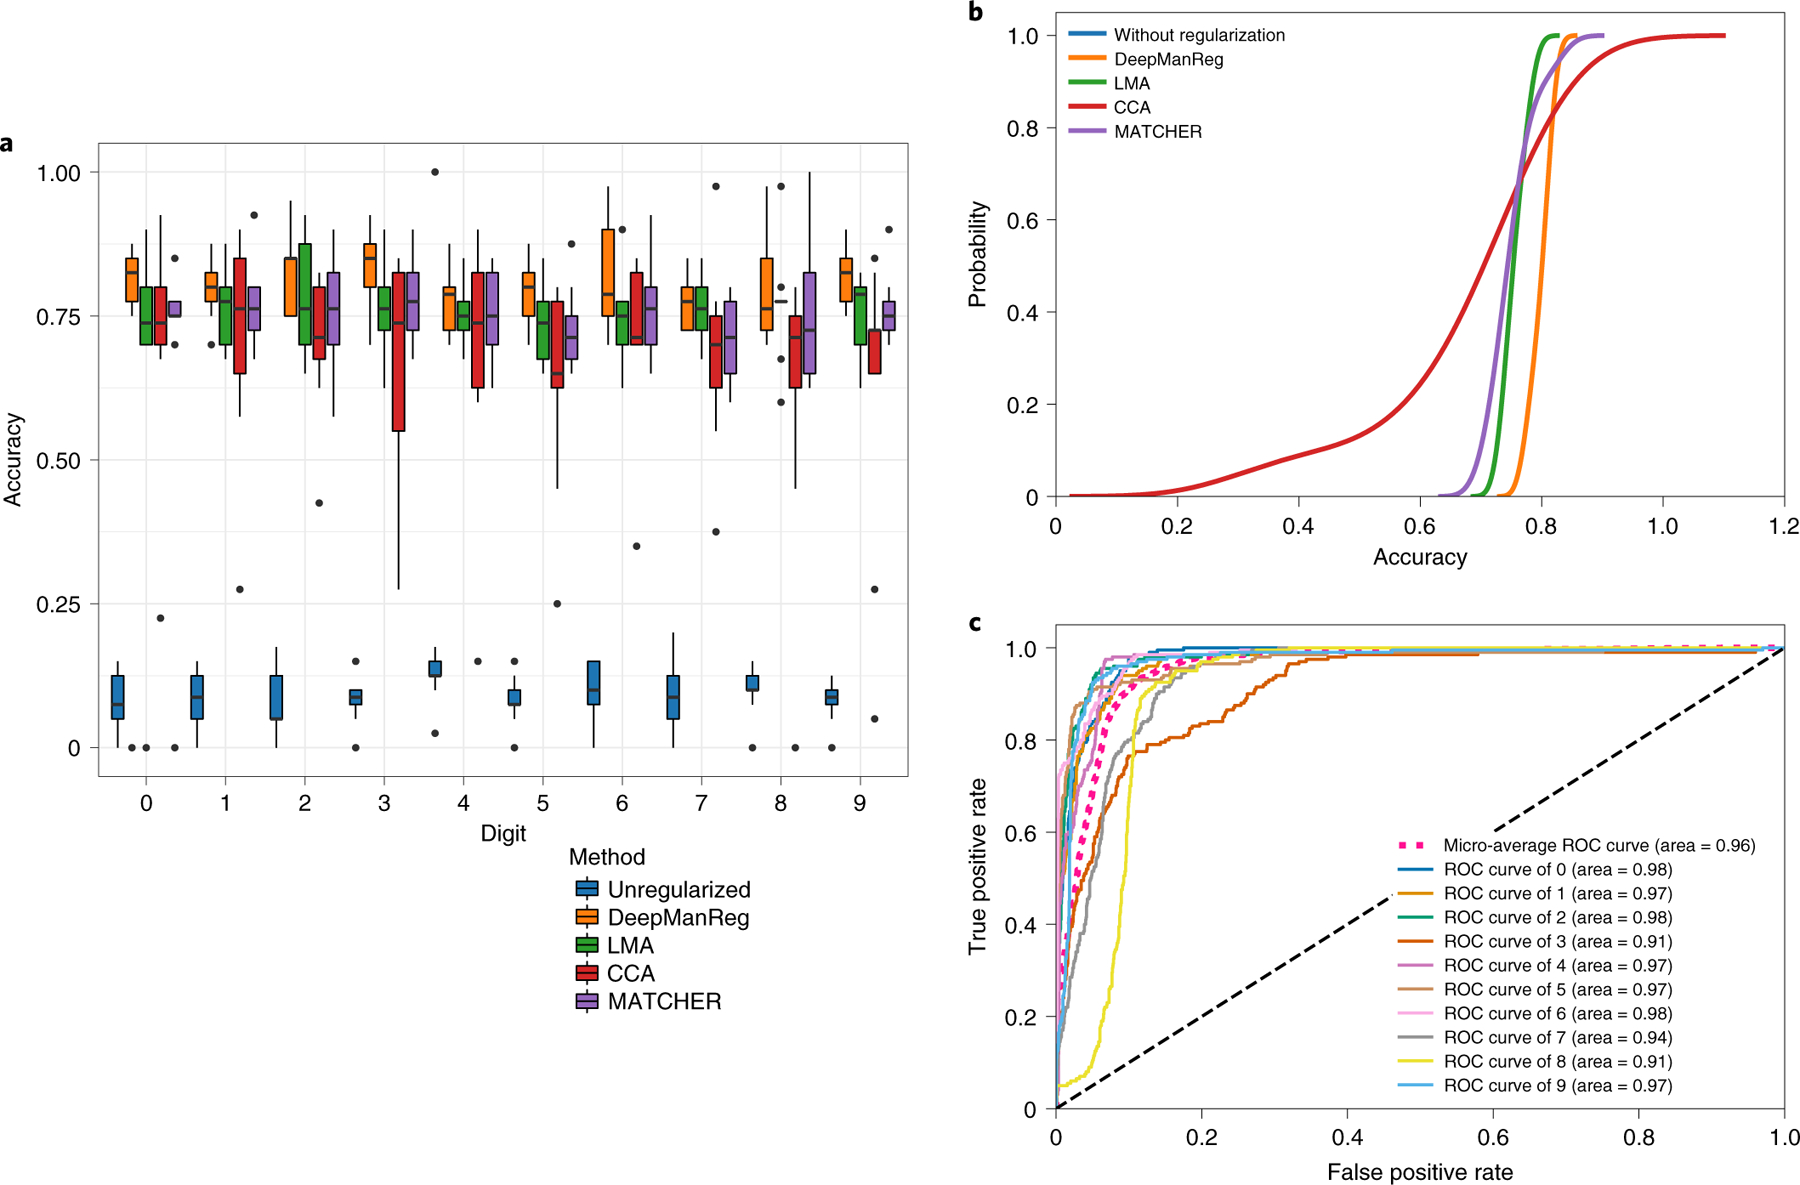
(A) Boxplot and (B) Cumulative distributions of testing accuracies for classifying digits by deepManReg (Orange) vs. the neural network classification without any regularization (Blue), by Linear Manifold Alignment (Green), CCA (Red), and MATCHER (Purple). The box extends from the lower to upper quartile values of the data (i.e., test accuracies of 10 experiments), with a line at the median. (C) Receiver operating characteristic (ROC) curves for classifying digits by deepManReg. x-axis: False Positive Rate, y-axis: True Positive Rate.