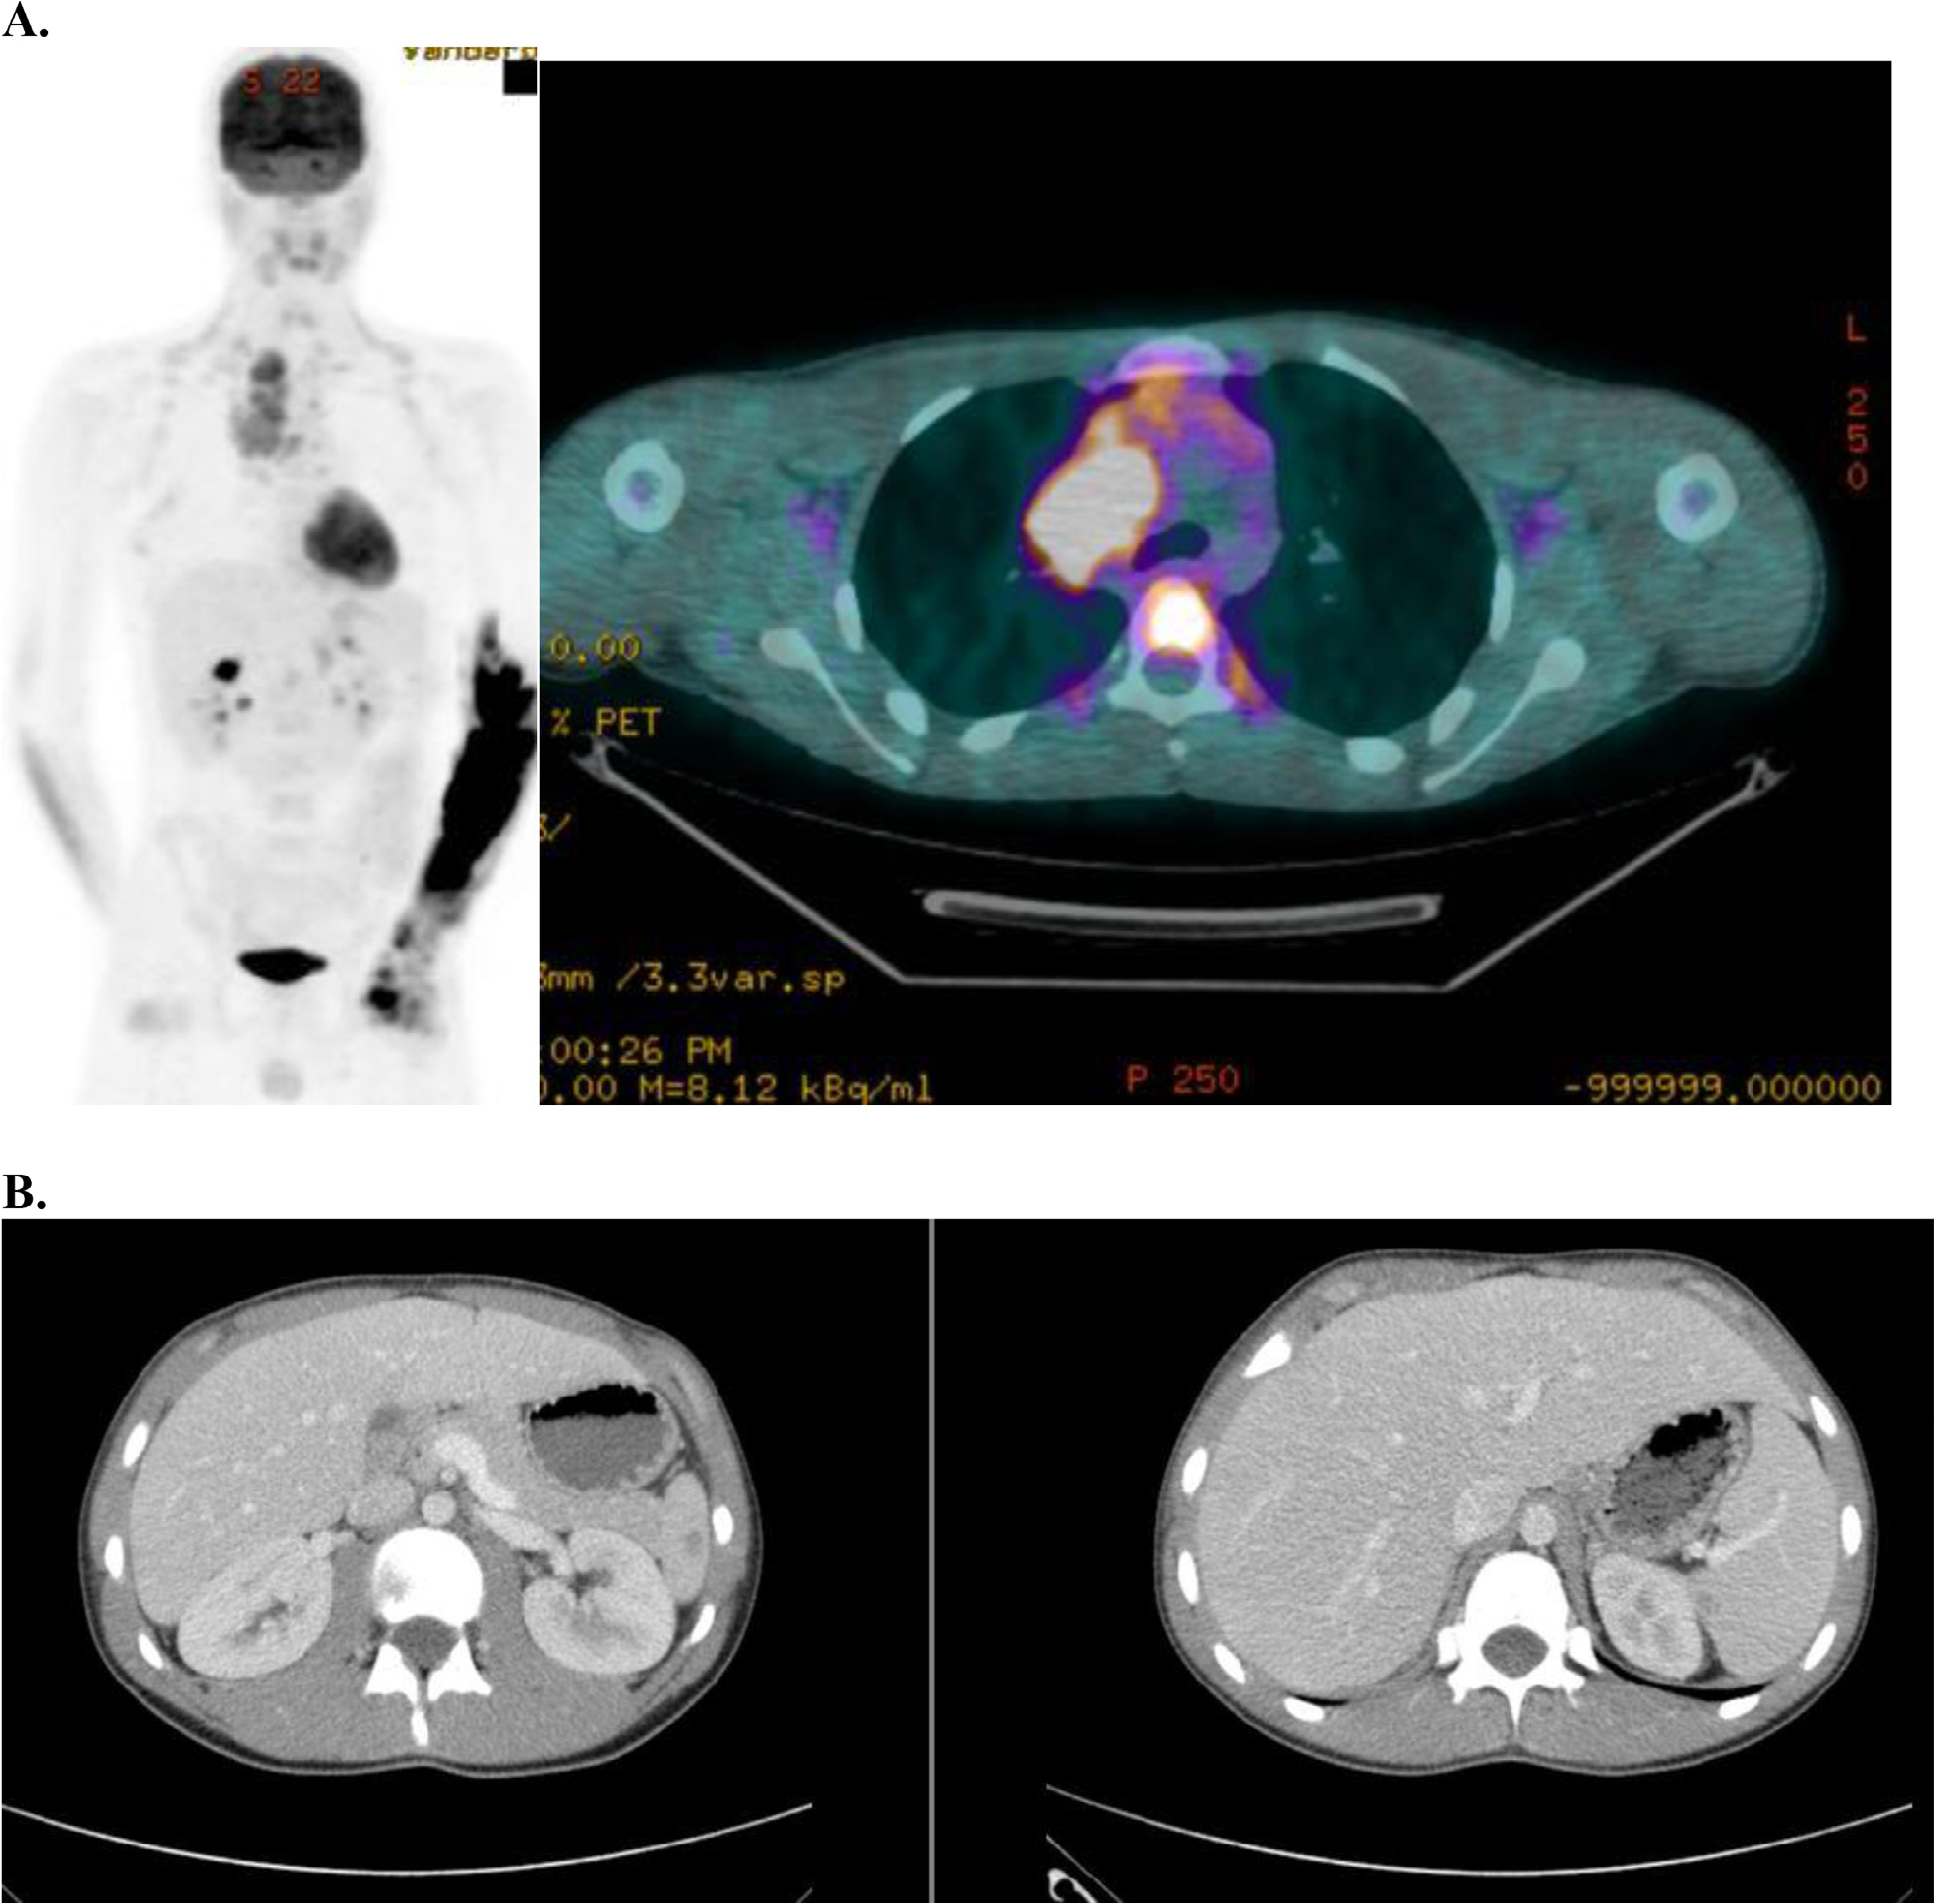
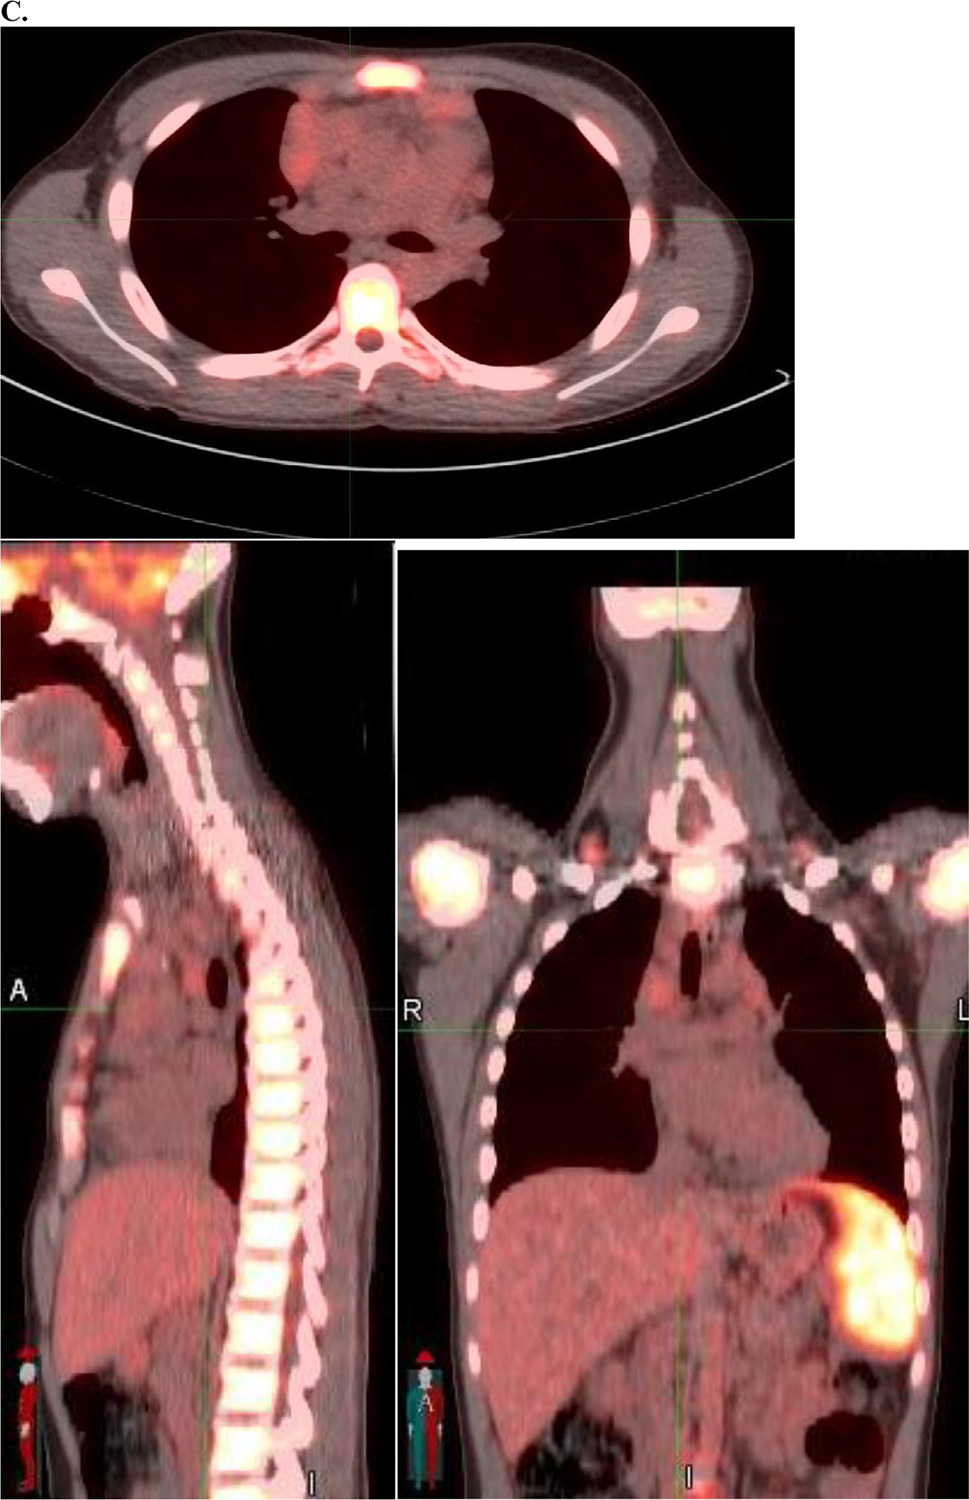
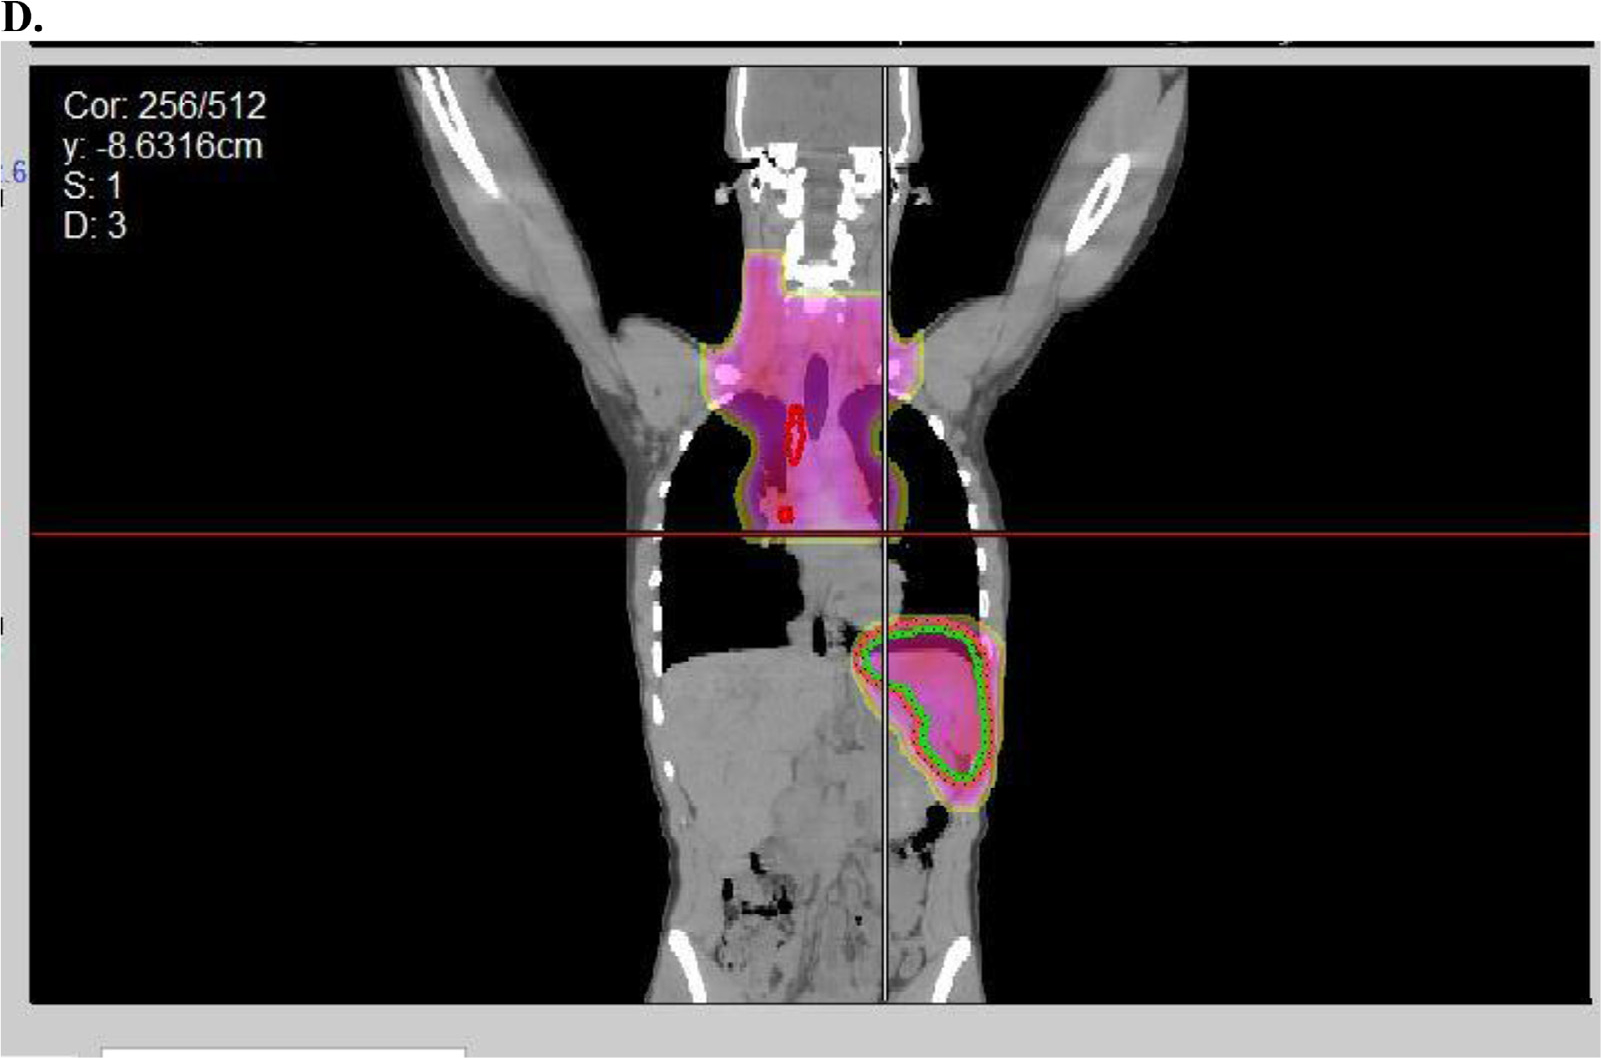
Fig. 1.


Example of radiation therapy fields used in AHOD0831. (A) Baseline positron emission tomography-computed tomography with maximum intensity projection image on left and axial slice in mediastinum showing bulky disease. (B) Spleen involvement at baseline was documented by several hypodensities that resolved with chemotherapy. (C) Postchemo positron emission tomography-computed tomography scan showing a rapid early response. (D) Radiation therapy (dose color-wash indicates 2100 cGy /14 fractions; 50% isodose line is depicted) was given in accordance to protocol with radiation therapy to bulk sites (mediastinum and spleen). Red indicates postchemo gross tumor volume; green indicates spleen clinical target volume.
