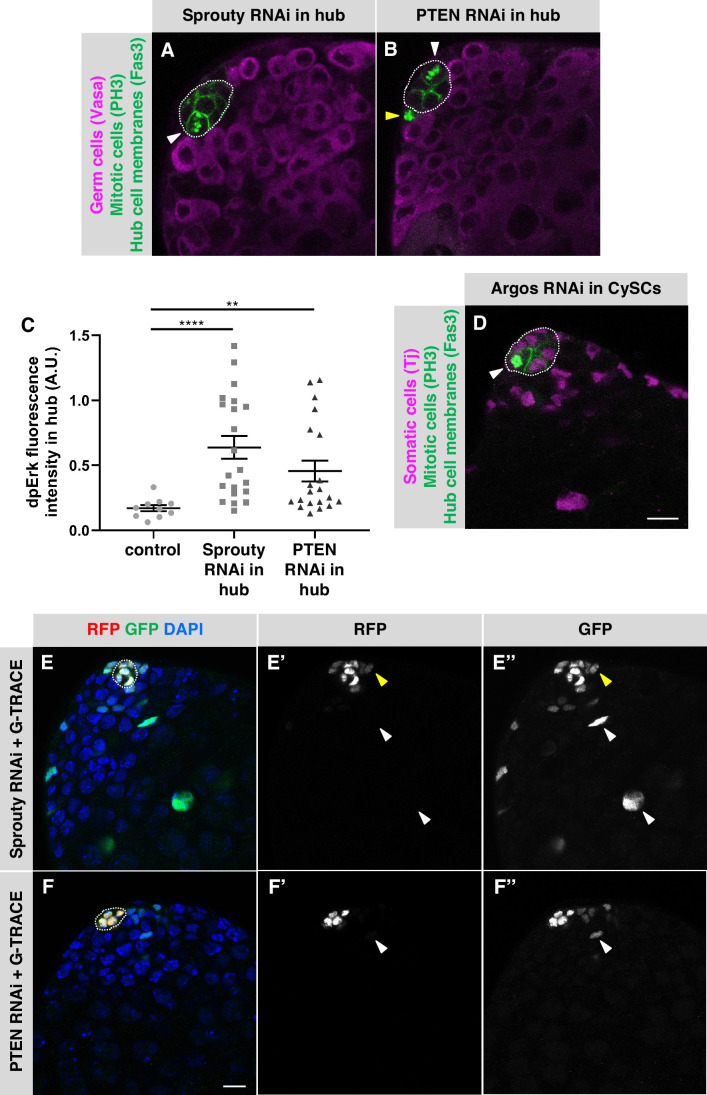
Figure 3. Negative regulators of EGFR signaling maintain hub cell quiescence and identity.
(A–B, D) Single confocal sections through the apex of testes immunostained for Fas3 (hub cell membranes, green), PH3 (mitotic chromosomes, nuclear green), and either (A–B) Vasa (germ cells, magenta) or (D) Traffic jam (Tj; somatic cell nuclei, magenta). Hubs are outlined in white. Mitotic hub cells (white arrowheads) are found after knockdown of Sprouty (A) or PTEN (B) in the hub or after knockdown of Argos (D) in cyst lineage cells. Mitotic cells outside the hub are also found (yellow arrowhead). (C) Quantification of dpERK levels in the hub in control, Sprouty knockdown, or Pten knockdown in the hub. dpErk levels in the hub are significantly higher when either Sprouty or Pten are knocked down in the hub than in control testes suggesting these proteins normally inhibit MAPK signaling in the hub. A.U., arbitrary units. Black bars indicate the mean and standard error. Unpaired t test, **p < 0.01, ****p < 0.0001. (E–F) Single confocal sections through the apex of testes after 8 days of G-TRACE lineage tracing system expression in adult hub cells. Testes were immunostained for RFP (red, current expression of the hub-specific driver E132-Gal4) and GFP (green, current and past expression of the driver) and counterstained with DAPI (blue; marks all nuclei). Hubs are outlined in white. (E'-F') Red channel alone, in white; (E"-F") green channel alone, in white. After knockdown of Sprouty (E) or PTEN (F) in the hub together with expression of G-TRACE, hub cells are marked with RFP and GFP, and cells outside the hub are also marked, either with GFP and low levels of RFP (yellow arrowheads) or with GFP only (white arrowheads), suggesting that marked cyst lineage cells arose by conversion of hub cells to CySCs. Scale bars in D (for A-B, D) and in F (for E-F) are 10 μm.

