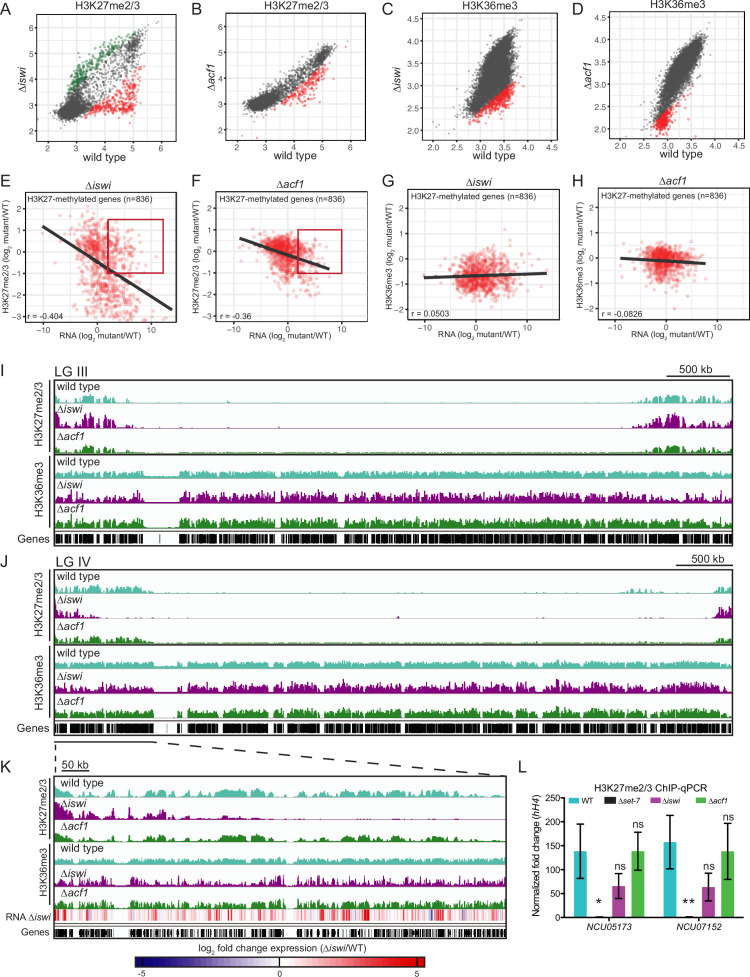
Figure 3. iswi and acf1 are required for wild-type H3K27me2/3 and H3K36me3 but loss of these methyl marks is not required for transcriptional upregulation.
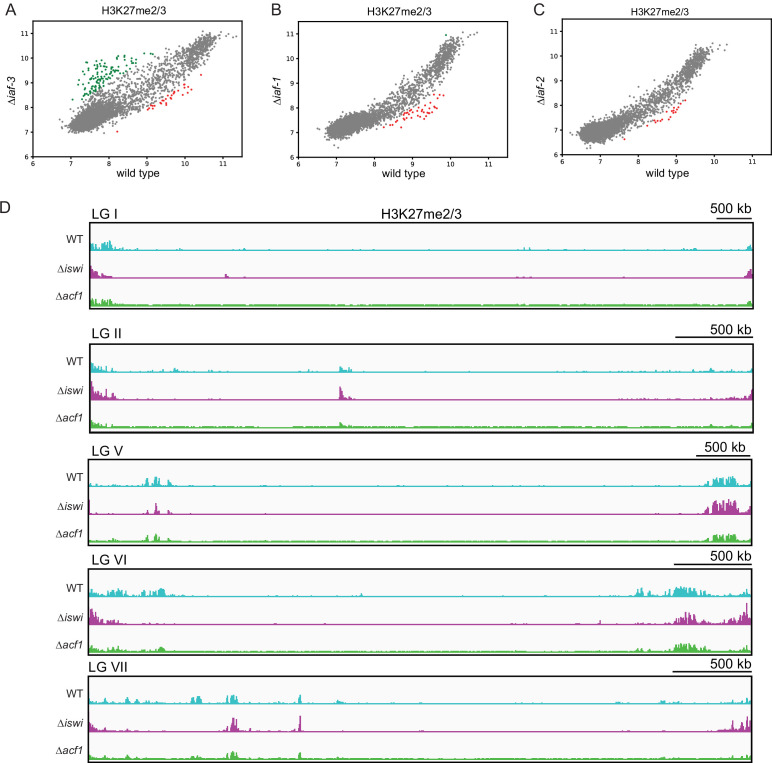
(A, B) Scatter plots show the correlation of H3K27me2/3 at genes in wild type and ∆iswi or ∆acf1 based on biological replicates of ChIP-seq data. Green points (n=260 in ∆iswi and n=0 in ∆acf1) represent genes with increased H3K27me2/3 levels (at least twofold over wild type) and red points (n=341 in ∆iswi and n=193 in ∆acf1) represent genes with decreased H3K27me2/3 levels (at least twofold relative to wild type) in the indicated mutant. (C, D) Scatter plots show the correlation of H3K36me3 at genes in wild type and ∆iswi or ∆acf1 based on biological replicates of ChIP-seq data. Green points (n=1 in ∆iswi and n=0 in ∆acf1) represent genes with increased H3K36me3 levels (at least twofold over wild type) and red points (n=444 in ∆iswi and n=317 in ∆acf1) represent genes with decreased H3K36me3 levels (at least twofold relative to wild type) in the indicated mutant. (E, F) Scatter plots show the correlation between H3K27me2/3 and gene expression at H3K27-methylated genes (n=836) in the indicated mutants. Pearson correlation coefficient is reported. Red box indicates genes (n=92 in ∆iswi and n=66 in ∆acf1) that are significantly upregulated (log2 fold change>2) but show no significant loss of H3K27me2/3 (log2 fold change>–1). (G, H) Scatter plots show the correlation between H3K36me3 and gene expression at H3K27-methylated genes (n=836) in the indicated mutants. Pearson correlation coefficient is reported. (I) ChIP-seq tracks showing average level of H3K27me2/3 or H3K36me3 merged from two biological replicates for the indicated strains on LG III. Y-axis is 0–1000 RPKM for H3K27me2/3 tracks and 0–100 average read counts for H3K36me3 tracks. (J) Same as in (I), but for LG IV. (K) Enlarged ChIP-seq tracks showing the underlined region on LG IV from (J). Gene expression changes in ∆iswi are shown. (L) ChIP-qPCR data for H3K27me2/3 at the two genes used for the initial mutant selection (NCU05173 and NCU07152) in the indicated strains. Filled bars represent the mean of technical triplicates and error bars show standard deviation (** for p<0.01, * for p<0.05, and ns for not significant; all relative to wild type by unpaired t-test). Data are from one representative experiment that was performed three times.
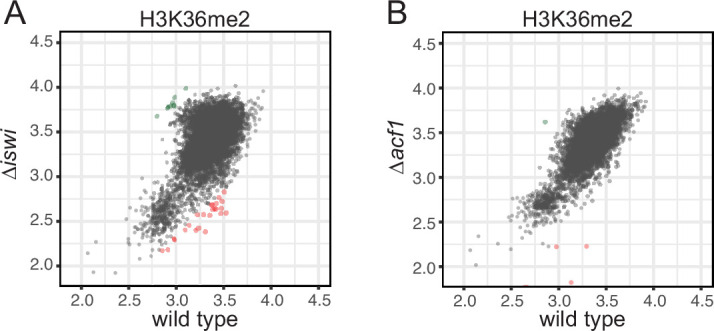
Figure 3—figure supplement 1. iswi and acf1 are not required for H3K36me2.


