. 2022 Mar 8;11:e77595. doi: 10.7554/eLife.77595

Figure 4. ACF1 localizes to H3K27me2/3-marked regions of the genome.

(A) Top track shows wild-type H3K27me2/3 levels based on ChIP-seq averaged from two biological replicates for one chromosome (LG III). Y-axis is 0–500 RPKM. Middle two tracks show DamID-seq average reads merged from two biological replicates for the indicated genotypes. Y-axis is 0–500 RPKM. Bottom track compares the DamID-seq reads from ∆set-7 strains to wild-type strains (shown above) displayed as the fold change between the two genotypes. Y-axis is –3–3. (B) Same as in (A), but showing an enlarged view of the right arm of LG III. Region shown is underlined in black in (A). (C) Average enrichment based on DamID-seq for each non-H3K27-methylated gene, scaled to 1 kb, ±500 base pairs, is plotted for the indicated strains. All lines represent average reads from two biological replicates except for Free-Dam which is from only one. TSS, transcription start site; TTS, transcription termination site. (D) Same as in (C), but for H3K27-methylated genes.

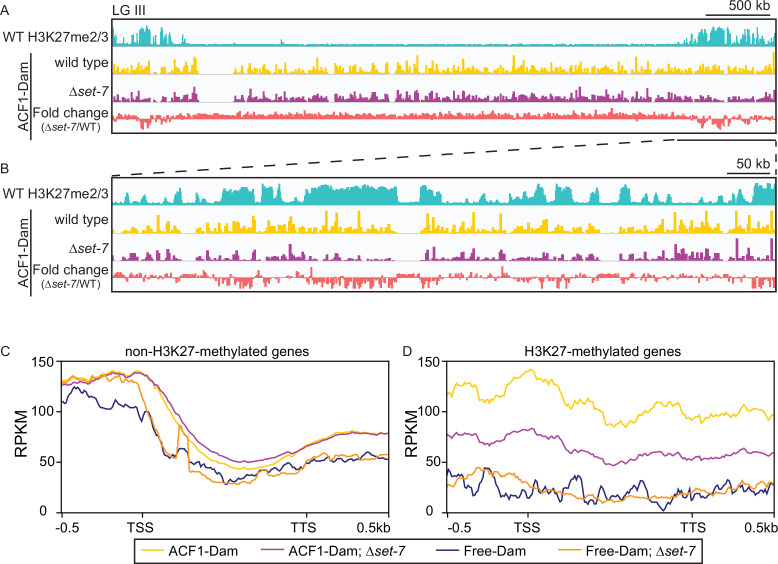
Figure 4.

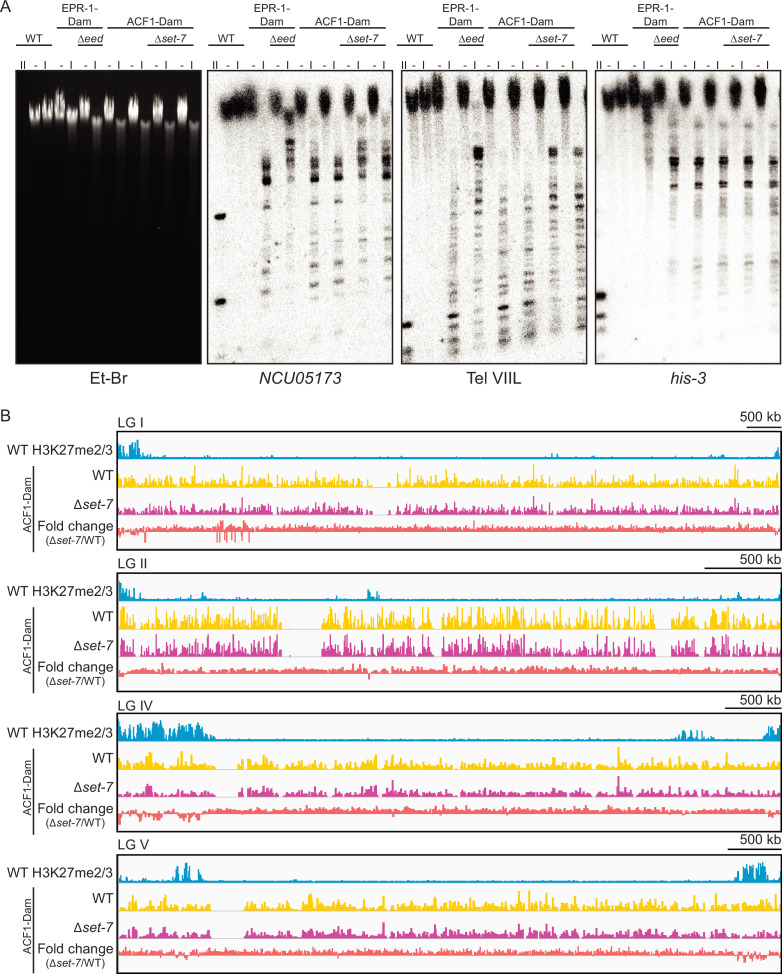
Figure 4—figure supplement 1. ACF1 localizes to H3K27me2/3-marked regions of the genome.

Figure 4—figure supplement 1.

(A) DamID Southern blot with genomic DNA from the indicated strains digested with DpnI (I), DpnII (II), or left undigested (–). DpnII, which digests GATC sites without methylated adenines, shows the pattern of complete digestion in wild type. DpnI, which only digests GATC sites bearing adenine methylation, reveals the extent of methylation by Dam at probed regions (NCU05173 and Tel VIIL, H3K27-methylated; his-3, euchromatin). Ethidium bromide (Et-Br) shows total DNA. Biological replicates are shown for ACF1-Dam strains. EPR-1 is a presumptive H3K27 methyl-binding protein and was used as a positive control. EED and SET-7 are both members of the PRC2 complex and are required for H3K27 methylation. See source data for raw, uncropped images. (B) Top track shows wild-type H3K27me2/3 levels averaged from two biological replicates of ChIP on the indicated linkage group. Y-axis is 0–500 RPKM. Middle two tracks show DamID-seq average reads from two biological replicates for the indicated genotypes. Y-axis is 0–500 RPKM. Bottom track compares the DamID-seq reads from ∆set-7 to wild type (above) to show the fold change between the two genotypes. Y-axis is –3–3.
Figure 4—figure supplement 1—source data 1. Raw image for Et-Br gel.
Figure 4—figure supplement 1—source data 2. Raw image for Southern blot probed with NCU05173.
Figure 4—figure supplement 1—source data 3. Raw image for Southern blot probed with Tel VIIL.
Figure 4—figure supplement 1—source data 4. Raw image for Southern blot probed with his-3.
Figure 4—figure supplement 1—source data 5. Raw, uncropped image for Et-Br gel with labels.
Figure 4—figure supplement 1—source data 6. Raw, uncropped image for Southern blot probed with NCU05173 with labels.
Figure 4—figure supplement 1—source data 7. Raw, uncropped image for Southern blot probed with Tel VIIL with labels.
Figure 4—figure supplement 1—source data 8. Raw, uncropped image for Southern blot probed with his-3 with labels.