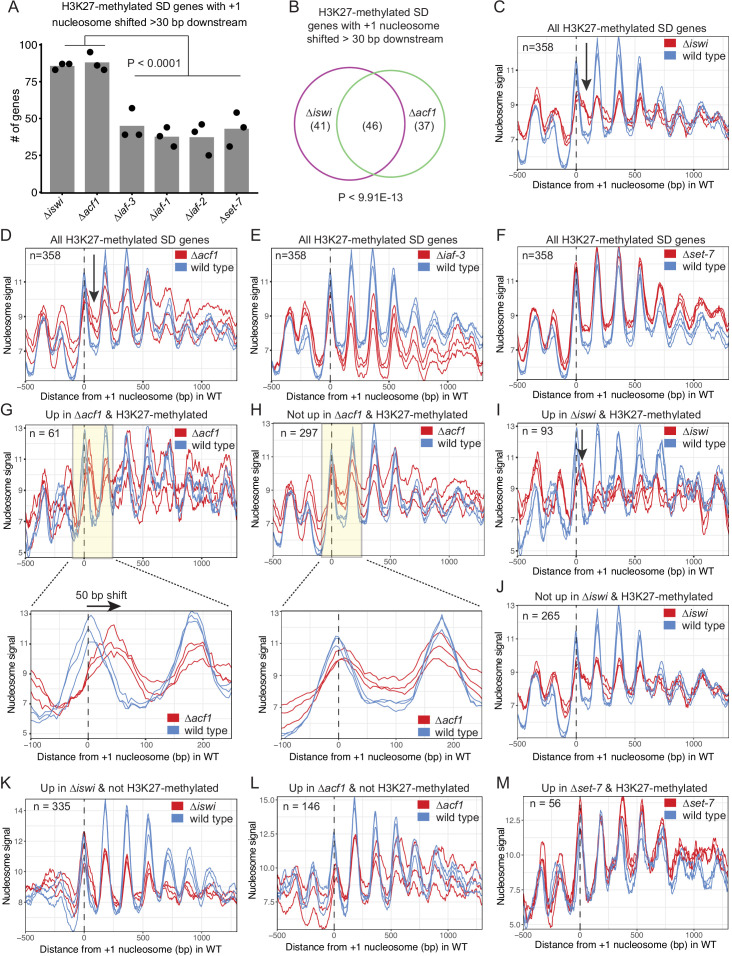
Figure 5. ISWI and ACF1 position the +1 nucleosome at H3K27-methylated, upregulated genes.
(A) Histogram of the number of H3K27-methylated SD genes (spectral density score for nucleosome order>2; n=358) that have the +1 nucleosome shifted downstream >30 base pairs when compared to wild type in the indicated mutant strains. Each point represents biological replicate 1, biological replicate 2, or analysis of the merged replicates and filled bar is the average of all three values. P values were determined with an unpaired t-test. (B) Venn diagram showing overlap of H3K27-methylated SD genes with a +1 nucleosome shifted downstream >30 bp when iswi or acf1 is deleted. P value was determined by hypergeometric probability test. (C–F) Average nucleosome signal at all H3K27-methylated SD genes plotted from MNase-seq data for the indicated mutants and wild type. The three colored lines represent biological replicate 1, biological replicate 2, and the average of the replicates for the strains indicated in the key. Arrows in (C) and (D) indicate the shifted +1 nucleosome. (G) Average nucleosome signal at SD genes that are upregulated (FDR <0.05) and marked by H3K27 methylation in ∆acf1 strains. The three colored lines represent biological replicate 1, biological replicate 2, and the average of the replicates. The boxed, shaded region is enlarged in the lower panel. (H) Same as panel (G), but for H3K27-methylated SD genes that are not upregulated in ∆acf1 strains. (I) Average nucleosome signal at SD genes that are upregulated (FDR <0.05) and marked by H3K27 methylation in ∆iswi strains. The three colored lines represent biological replicate 1, biological replicate 2, and the average of the replicates. Arrow indicates the shifted +1 nucleosome. (J) Same as (I), but for H3K27-methylated SD genes that are not upregulated in ∆iswi strains. (K, L) Average nucleosome signal at SD genes that are upregulated (FDR <0.05) and not marked by H3K27 methylation in ∆iswi (K) and ∆acf1 (L) strains. The three colored lines represent biological replicate 1, biological replicate 2, and the average of the replicates. (M) Same as (I), but for H3K27-methylated SD genes that are upregulated in ∆set-7.


