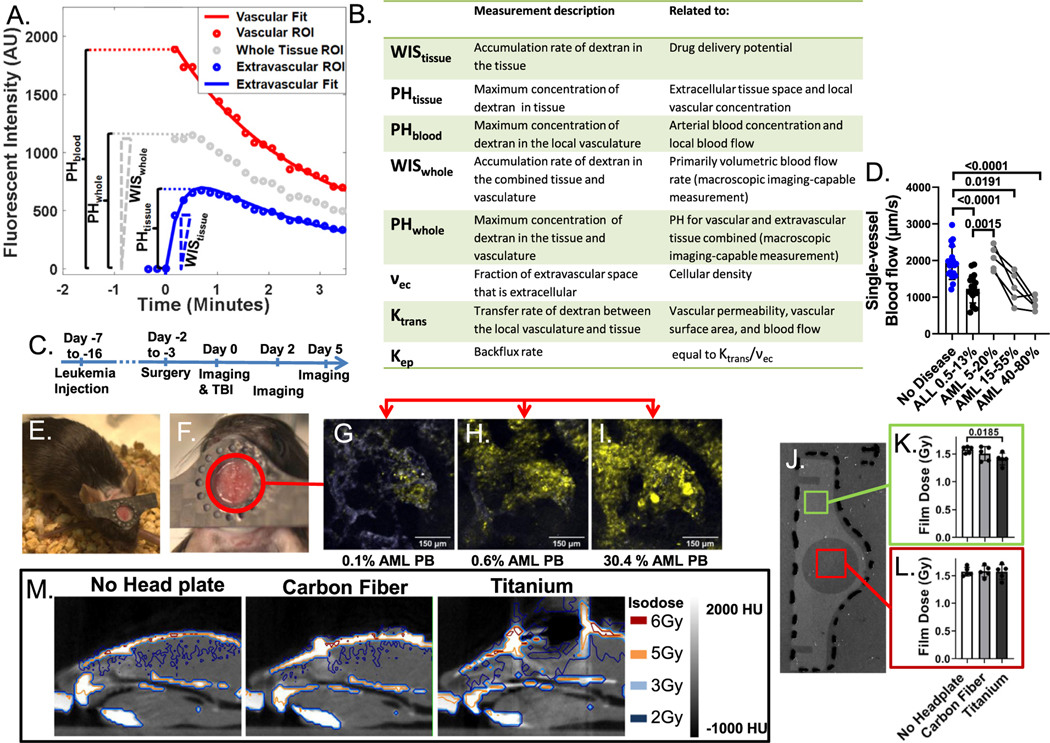
Fig. 1.
Time-lapsed imaging parameters and validation of longitudinal cranial window head plates. (A) Fluorescent intensity values from extravascular tissue, vascular tissue, and whole tissue regions of interest (ROIs) from time-lapsed longitudinal quantitative multiphoton microscopy (L-QMPM) images during the injection of 4 kDa tetramethylrhodamine-isothiocyanate (TRITC) dextran. Three background frames are taken before the injection of contrast to calculate the average background fluorescent intensity for the vascular, extravascular, and whole tissue ROIs. The average background fluorescent intensities are subtracted from the respective time-lapsed fluorescent intensity data. Solid lines represent fitted functions for the vascular and extravascular tissue compartments used to obtain kinetic transfer rate, backflux rate, and extracellular extravascular space. Wash-in slope and wash-in slope for the whole tissue ROI are depicted as the maximum positive slope between image frames for the extravascular tissue ROI and whole tissue ROI, respectively. (B) A summary of imaging parameters used in this study. (C) The L-QMPM imaging schema. (D) Single-vessel blood flow values for wild-type mice and mice with varying percentages of leukemia in peripheral blood. Mice bearing acute lymphoblastic leukemia were imaged 7 to 8 days after acute lymphoblastic leukemia injection and mice bearing acute myeloid leukemia (AML) were imaged longitudinally 9, 11, and 14 days after AML injection. (E,F) Photos of mice with longitudinal cranial windows. L-QMPM images of green fluorescent protein + AML cell growth (green) in the calvarium at (G) 4, (H) 6, and (I) 10 days post-AML injection shown with corresponding peripheral blood measurements. (J) A picture of dosimetric film after x-ray exposure while directly underneath a titanium head plate. Film dose measurements from a lack of head plate, carbon fiber head plates, and titanium head plates obtained both (K) underneath the head plate material and (L) in the imaging area. (M) Computed tomography images with corresponding isodose lines for mice with no head plate, carbon fiber head plate, and titanium head plate. Abbreviations: ALL = acute lymphoblastic leukemia; AML = acute myeloid leukemia; AU = arbitrary units; HU = hounsfield unit; Kep = backflux rate; Ktrans = kinetic transfer rate; PB = peripheral blood; PHblood = peak height for the vascular tissue region of interest; PHtissue = peak height for the extravascular tissue region of interest; PHwhole = peak height for the whole tissue region of interest; ROI = region of interest; TBI = total body irradiation; νec = extracellular extravascular space; WIStissue = wash-in slope; WISwhole = wash-in slope for the whole tissue region of interest.

