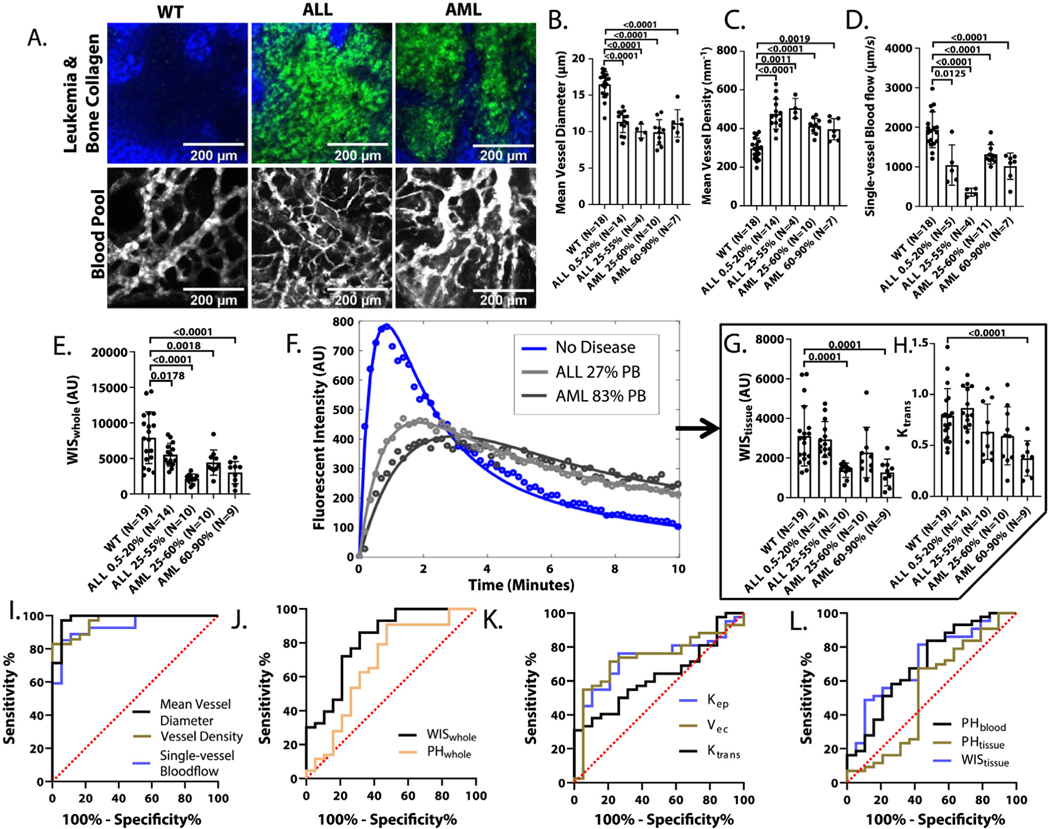
Fig. 2.
Bone marrow vasculature remodeling with the onset of leukemia. (A) Top: images of green fluorescent protein + leukemia (green) and second harmonic generation from the collagen in the bone (blue). Bottom: Images of bone marrow vasculature blood pool fluorescence from Qtracker™ 655 vascular labels (white). Longitudinal quantitative multiphoton microscopy measurements of (B) mean vessel diameter, (C) mean vessel density, (D) single-vessel blood flow, (E) wash-in slope for the whole tissue region of interest, (G) wash-in slope, and (H) kinetic transfer rate for wild-type mice and mice with varying leukemic burdens measured through peripheral blood sampling. (F) Four kDa dextran fluorescent intensity from extravascular tissue regions of interest from a wild-type mouse, mouse bearing acute lymphoblastic leukemia, and mouse bearing acute myeloid leukemia. Solid lines indicate the corresponding fitting function used for compartmental modeling. (I-L) Receiver operating characteristic curves for a variety of longitudinal quantitative multiphoton microscopy parameters. A single measurement time point from each mouse, typically matching the highest untreated disease burden, was used for analysis of all imaging parameters. Abbreviations: ALL = acute lymphoblastic leukemia; AML = acute myeloid leukemia; AU = arbitrary units; Kep = backflux rate; Ktrans = kinetic transfer rate; PHblood = peak height for the vascular tissue region of interest; PHtissue = peak height for the extravascular tissue region of interest; PHwhole = peak height for the whole tissue region of interest; νec = extracellular extravascular space; WIStissue = wash-in slope; WISwhole = wash-in slope for the whole tissue region of interest; WT = wild-type.

