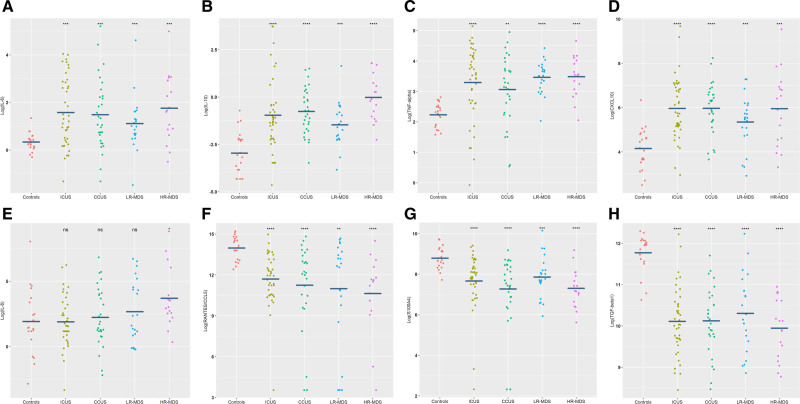
Figure 1.
Blood plasma levels of IL-6 (A), IL-10 (B), TNF-α (C), CXCL10 (D), IL-8 (E), RANTES/CCL5 (F), S100A4 (G), and transforming growth factor beta 1 (TGF -β1) (H) in four groups of patients (N = 111) compared with healthy elderly controls (N = 21). All cytokine levels are shown after log2-transformation. One-way ANOVA test is used for comparison between the two groups for each cytokine; *P < 0.05, **P < 0.01, ***P < 0.001, ****P < 0.0001. ANOVA = analysis of variance; CCUS = clonal cytopenias of undetermined significance; CXCL10 = C-X-C motif chemokine 10; HR-MDS = higher-risk myelodysplastic syndromes; ICUS = idiopathic cytopenias of undetermined significance; IL = interleukin; LR-MDS = lower-risk myelodysplastic syndromes; RANTES = regulated on activation normal T-cell expressed and secreted; TNF-α = tumor necrosis factor α.

