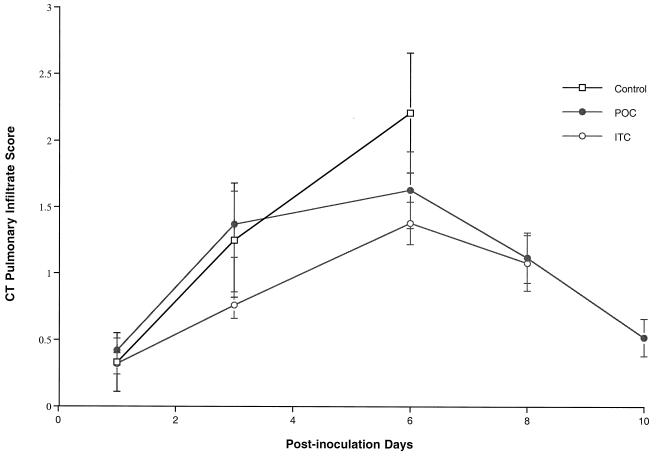
FIG. 4.
Pulmonary infiltrate scores determined by image analysis of serial ultrafast CT scans of UC, POC-treated rabbits, and ITC-treated rabbits. Pulmonary infiltrates increased during the first 6 days in UC and treated rabbits. The pulmonary infiltrate curve ends on day 6 due to mortality in the UC. Pulmonary infiltrates declined following day 6 in both the POC and ITC treatment groups. The ITC curve ends on day 8 due to mortality.

