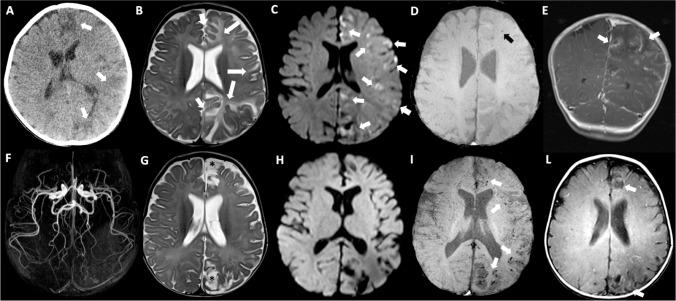
Fig. 1.
Brain CT executed at the onset of seizures showed cortico-subcortical hypodense areas in left frontal and parietal lobes (arrows in A). Brain MRI obtained after two days from CT (B,C,D,E) showing involvement of the left hemisphere especially affecting frontal, parietal and cingulate regions with little mass effect. Note the slight hyperintensity of the affected cortex compared to the controlateral normal cortex (short arrows), and the more marked subcortical hyperintensity related to vasogenic edema on T2-weighted image (long arrows) (B). Restricted diffusion is evident on DWI in a lot of cortico-subcotical regions on the left side (arrows in C). Only one punctiform hypointense image is observable in the white matter of the left frontal lobe on SWI (black arrow in D). Cortical and leptomeningeal enhancing streaks (arrows) are quite evident after gadolinium injection on coronal T1-weighted image (E). MRI of the brain at two weeks follow-up (F, G,H,I,L). 3D TOF MR Angiography MIP image of the circle of Willis shows no vascular stenoses (F). Gliotic-malacic evolution of some previously affected areas is especially observable in left parasagittal frontal and parietal lobes (asterisks) in association with ventricular and ipsilateral sulcar enlargement on axial T2-weighted image (G). Cytotoxic edema and signal restriction disappeared on DWI (H). Punctiform cortico-subcortical microbleeds, and curvilinear hyperintensities related to cortical laminar necrosis, on SWI (arrows in I), and T1-weighted images without gadolinium injection (arrows in L) in the left affected areas

