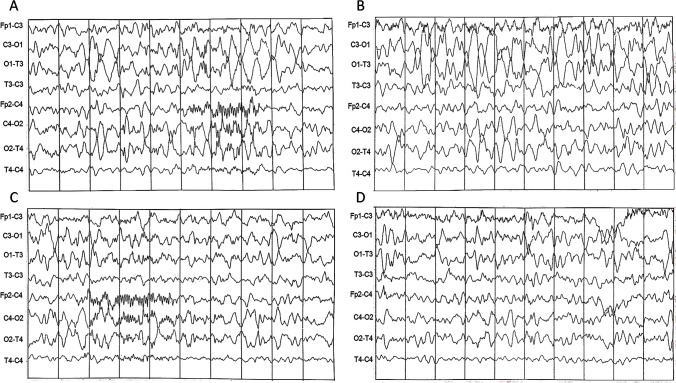
Fig. 2.
Sleep EEG showing an asymmetry of cerebral background activity with high voltage delta activity on the left temporo-occipital areas and reduced representation of spindles on the left frontal areas (A–C). Spike-waves complexes were also evident on the left frontal regions (D). EEG parameters: Notch 50 Hz, LF: 30 Hz, TC: 0,1 sec

