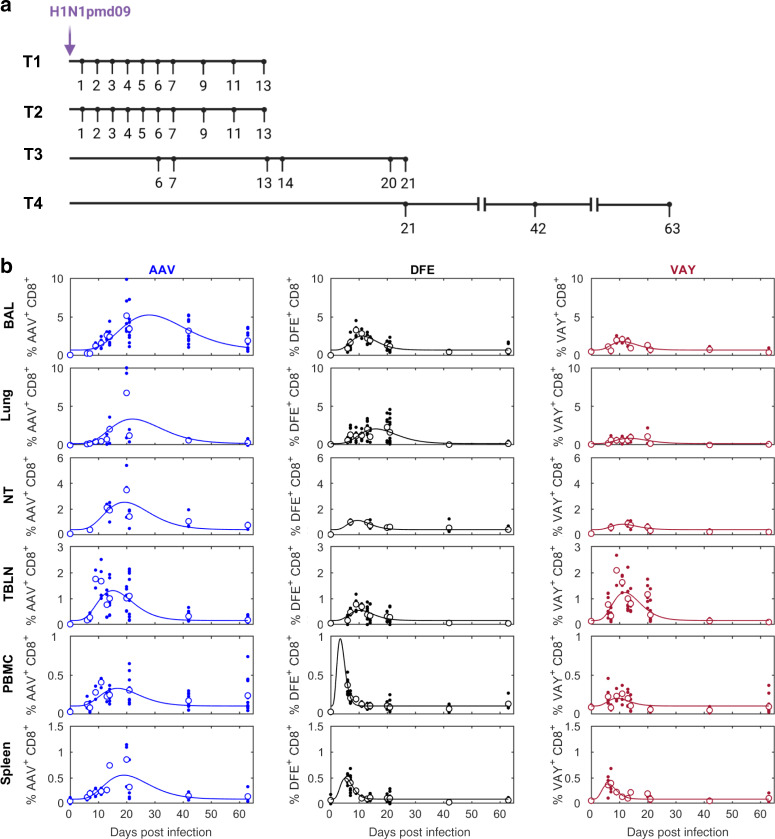
Fig. 2. Experimental design and tetramer distribution in tissues.
a Babraham pigs were infected with H1N1pdm09 intranasally. One pig was culled on each day post infection in experiments T1 and T2, three on each day in T3 and four on each day in T4. Broncho-alveolar lavage (BAL), lung, tracheo-bronchial lymph nodes (TBLN), peripheral blood mononuclear cells (PBMC) and spleen were collected at all time points (n = 3 at 0, 14, 20 DPI; n = 5 at 6, 7, 13 DPI; n = 2 at 9, 11 DPI; n = 7 at 21 DPI; n = 4 at 42, 63 DPI) while nasal turbinates (NT) were isolated only in experiments T3 and T4 (n = 2 at 0, 7, 13 DPI; n = 3 at 14, 20, 21 DPI; n = 4 at 42, 63 DPI) b Proportion (%) of CD8+ T cells specific for AAV (left), DFE (middle) or VAY (right) in different tissues. In each plot the solid line is the fitted curve describing the dynamics, the large open circles are the mean % at each time point and the small filled circles are the observed % for individual pigs at each time point.

