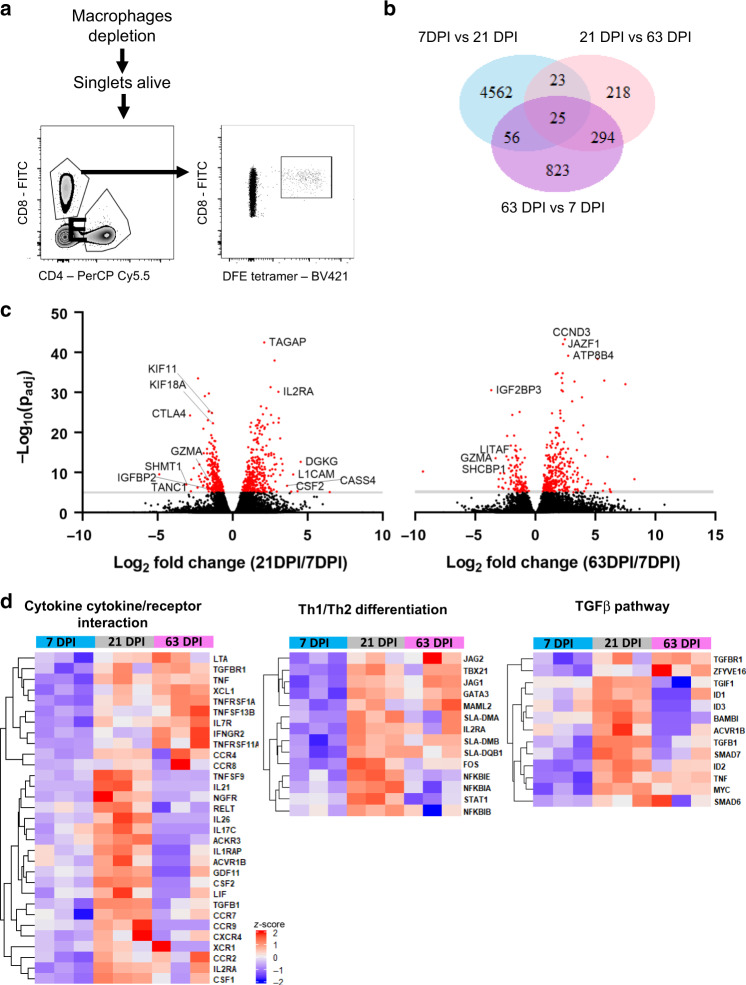
Fig. 5. Transcriptional profile of DFE-specific T cells in BAL at 7, 21 and 63 DPI.
a Sorting strategy for the isolation of DFE + T cells for RNA-seq. b Venn diagram shows the number of significant differentially expressed genes (padj value<0.05, and |log2 fold change | > 1) between 7DPI versus (vs) 21 DPI, 21DPI vs 63DPI and 63DPI vs 7DPI samples (n = 3). c Volcano plot showing upregulated genes in 21DPI vs 7DPI and 63DPI vs 21DPI comparison. d Heatmap of selected genes from KEGG Pathway analysis related to cytokine production, T cell differentiation and TGFβ pathway (enrichment score of 0.76, 0.88 and 0.83 respectively).

