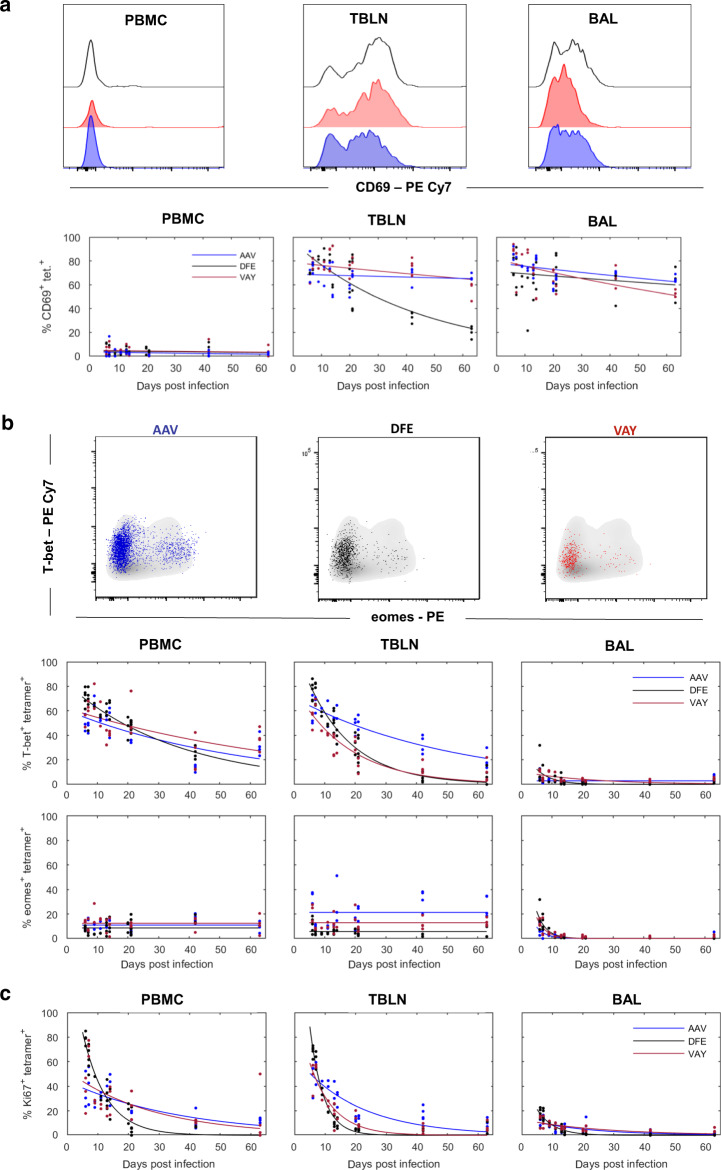
Fig. 6. Activation state and transcription factors expression in tetramer+ CD8 T cells.
(a) Top: Histograms show the expression of CD69 by DFE (black), VAY (red) and AAV (blue) tetramer+ T cells in PBMC (left), TBLN (centre) and BAL (left) at 21 DPI. Bottom: Frequencies of tetramer+ cells expressing CD69 in PBMC, TBLN and BAL. b Top: Expression of T-Bet and Eomes by AAV (left, blue), DFE (centre, black) and VAY (right, red) tetramer + (coloured dots) and total CD8 T cells (in grey) isolated at 21 DPI from TBLN, representative plots for one individual. Bottom: Frequencies of tetramer+ cells expressing T-bet and Eomes in PBMC, TBLN and BAL. C Proportion of AAV, DFE and VAY tetramer+ expressing Ki67 in PBMC, TBLN and BAL. In each plot the solid line is the fitted curve describing the dynamics and the points are the observed proportions for individual pigs at each time point (for n see legend to Fig. 2).

