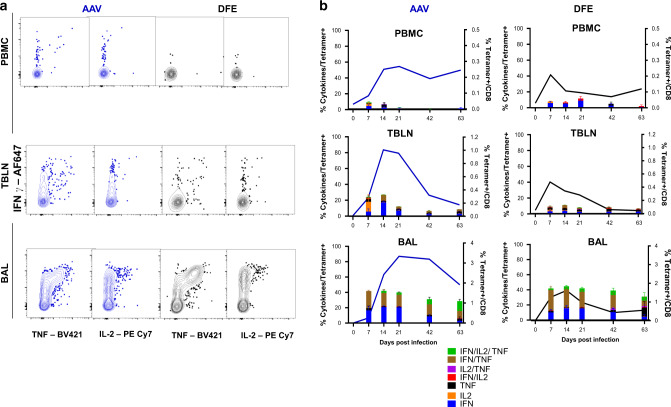
Fig. 7. Cytokine secretion after ex vivo virus stimulation of AAV and DFE tetramer+ cells.
(a) Lymphocytes isolated at different time points from blood, TBLN and BAL were stimulated with H1N1pdm09 MOI = 1. Following 18 h of stimulation, cells were labelled using tetramers and cytokines quantified using intracellular cytokine staining. Representative plots of AAV + (on left) and DFE + (right) T cells secreting IFNγ, TNF and IL-2 cytokines, from lymphocytes isolated 14 DPI. b Mean frequency (±SEM) of tetramer+ cells secreting IFNγ, TNF and IL-2 from PBMC (top panels), TBLN (in the middle) and BAL (bottom). The right Y axes shows the mean frequency of AAV + (in blue, left panels) and DFE + (in black, right panels) within CD8 T cells. Data shown are mean of 3/4 individuals per timepoint. Two-way ANOVA was used for comparison of each cytokine population between DFE+ and AAV+ cells.

