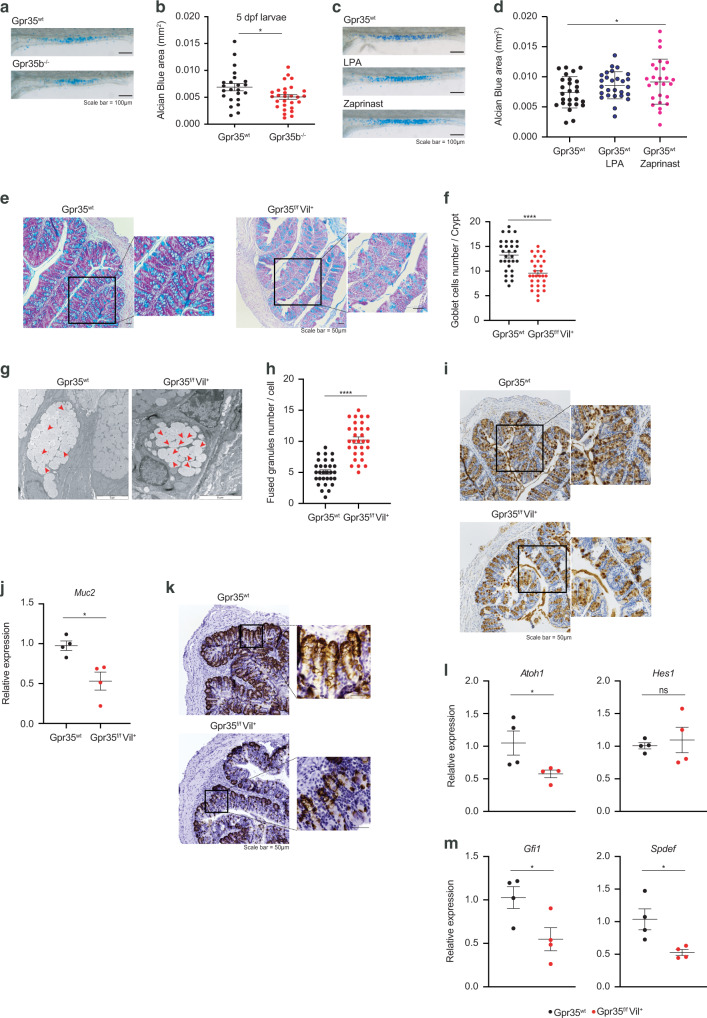
Fig. 1. Epithelial cell-specific Gpr35 deletion reduces goblet cell numbers.
a Representative magnification of the intestine of either Gpr35wt or Gpr35b−/− zebrafish larvae showing Alcian blue staining. Scale bars, 100 μm. b Quantification of the Alcian blue area in (a) performed by using automatic Alcian blue color deconvolution in ImageJ. 1 dot = 1 larva. c Representative magnification of the intestine of Gpr35wt zebrafish larvae untreated or treated with either zaprinast or LPA and stained with Alcian blue. Scale bars, 100 μm. d Quantification of the Alcian blue area in (c) performed by color deconvolution. 1 dot = 1 larva. e Representative AB/PAS staining of proximal colon sections obtained from Gpr35f/fVil+ and Gpr35wt co-housed littermates. Scale bars, 50 μm. f Cell count of goblet cells in (e) performed blindly by two different investigators in at least 30 crypts. g Transmission electron microscopy analysis of goblet cell morphology in the proximal colon of Gpr35f/fVil+ and Gpr35wt co-housed littermates. Red arrowheads indicate fused granules. Scale bars, 5 μm. h Quantification of the number of mucin granules per goblet cell in (g) performed blindly by two different investigators in at least 30 cells. i Representative images of proximal colon sections obtained from Gpr35f/fVil+ and Gpr35wt co-housed littermates and stained for Muc2 protein by immunohistochemistry. Scale bars, 50 μm. j mRNA expression levels of Muc2 measured by RT-qPCR in proximal colon samples obtained from Gpr35f/fVil+ (n = 4) and Gpr35wt co-housed littermates (n = 4). k Representative images of proximal colon sections obtained from Gpr35f/fVil+ and Gpr35wt co-housed littermates and stained for Agr2 protein by immunohistochemistry. Scale bars, 50 μm. mRNA expression levels of (l) Atoh1, Hes1, (m) Gfi1 and Spdef measured by RT-qPCR in proximal colon samples obtained from Gpr35f/fVil+ (n = 4) and Gpr35wt co-housed littermates (n = 4). Each dot represents one animal with medians. Data are represented as mean ± SEM, ns not significant, *p ≤ 0.05, **p ≤ 0.01, ***p ≤ 0.001, ****p ≤ 0.0001 by Mann–Whitney U test.

