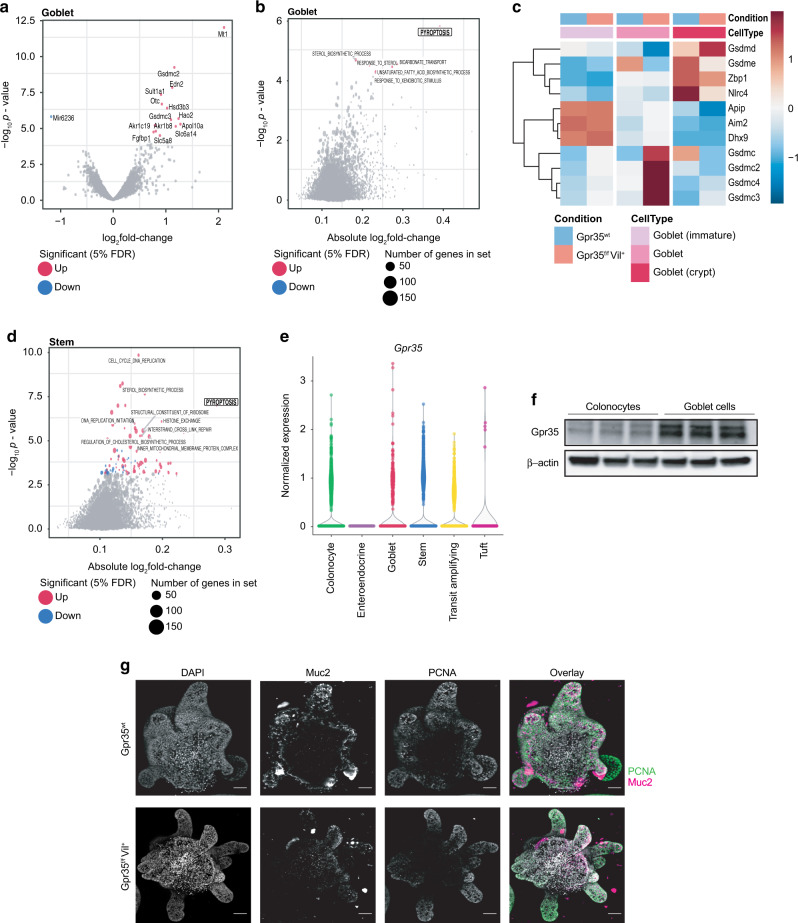
Fig. 4. Increased pyroptotic signatures in goblet cells lacking epithelial Gpr35.
a Volcano plot showing genes that are differentially expressed between Gpr35f/fVil+ (n = 4) and Gpr35wt goblet cells (n = 4). Gray dots highlight all genes analyzed; red or blue dots highlight genes significantly up or down-regulated genes in Gpr35f/fVil+ cells. Gpr35 was omitted from the plots for readability. b Gene set enrichment analysis of differential expression results from goblet cell clusters comparing Gpr35f/fVil+ to Gpr35wt cells. c Heatmap of genes from the Gene Ontology category pyroptosis, displaying the centered and scaled average expression across cells from the goblet cell clusters from both groups. d Gene set enrichment analysis on differential expression results from stem cell clusters comparing Gpr35f/fVil+ to Gpr35wt cells. e Normalized expression levels of Gpr35 in Gpr35wt cells from the scRNA-seq dataset, across annotated cell types. f Protein expression of Gpr35 in colonocytes and goblet cells sorted from the proximal colon of Gpr35wt mice (n = 3). g Images of proximal Gpr35wt (top panel) and Gpr35f/fVil (bottom panel) colon organoids. MIP of confocal z-stacks. Nuclei are stained with DAPI (blue); Goblet cells are stained with Muc2 (magenta); Proliferating cells are stained with PCNA (green); scale bar, 50 µm.

