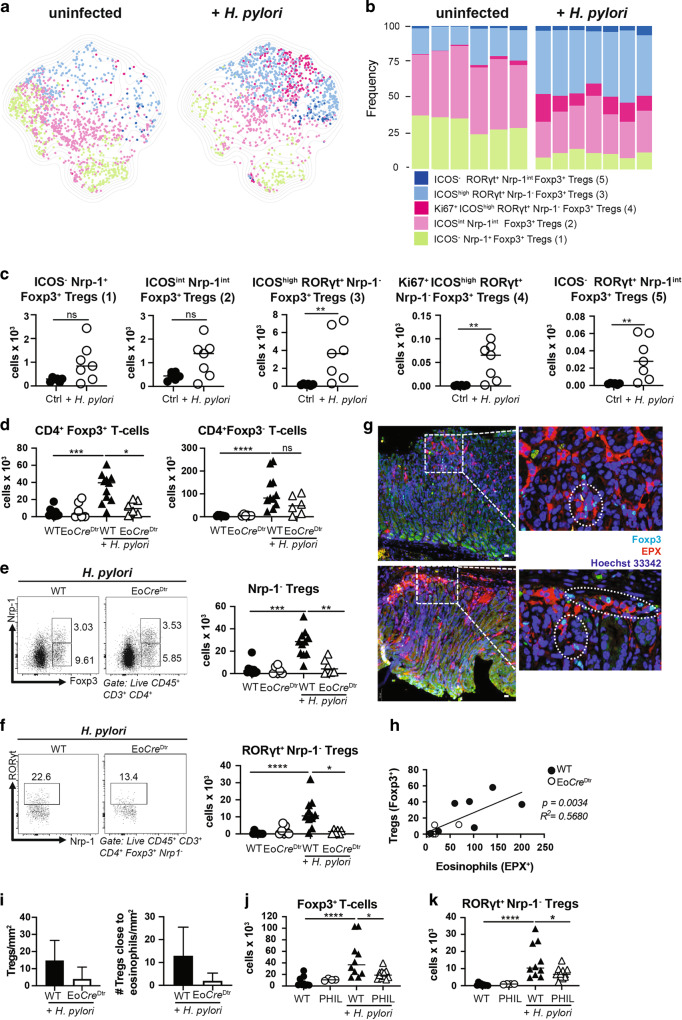
Fig. 1. The selective ablation of eosinophils results in reduced Treg populations in infected tissues.
a–c Multidimensional analysis of gastric Treg populations in H. pylori-infected and control mice. a UMAP of 1000 stochastically selected gastric CD4+ Foxp3+ Tregs from seven infected (right) and six uninfected mice (left). b Frequencies of the five indicated Treg populations of the mice shown in a; the color code in a and b corresponds to the five gastric Treg populations described in the text. c Absolute counts of the five Treg populations shown in a, b. d–i Eo-CreDTR mice and their wild-type (Cre-WT) littermates were infected with H. pylori strain PMSS1 for 6 weeks; all mice (WT and Eo-CreDTR) received diphtheria toxin (DT) twice a week for the entire time course to deplete eosinophils. Absolute counts of gastric Foxp3+ and Foxp3− CD4+ T-cells are shown in d; absolute counts of gastric Foxp3+ Nrp-1− Tregs are shown in e alongside representative FACS plots of the two infected groups. Absolute counts of gastric RORγt+ Nrp-1− Tregs are shown in f alongside representative FACS plots. Immunofluorescence microscopy of EPX-positive eosinophils and of Foxp3+ Tregs in the gastric mucosa of infected mice is shown in g for two representative WT mice along with high magnification insets (scale bar, 10 μm). Treg vs. eosinophil numbers per mm2 are plotted for all mice in h; means of Treg numbers ± standard deviation/mm2 and the means ± standard deviation of Tregs/mm2 in direct contact with eosinophils are plotted in i. Two independent studies were pooled in d–f, and one study is shown in h and i. j, k PHIL mice and their WT littermates were infected with H. pylori strain PMSS1 for 6 weeks. Absolute counts of gastric lamina propria Foxp3+ Tregs and RORγt+ Nrp-1− Tregs are shown relative to uninfected controls. Data in j and k are pooled from two studies. Statistical comparisons were performed by Mann–Whitney (two groups) or Kruskal–Wallis (more than two groups) test followed by Dunn’s post hoc test. *p < 0.05, **p < 0.01, ***p < 0.001, ****p < 0.0001, ns not significant.

