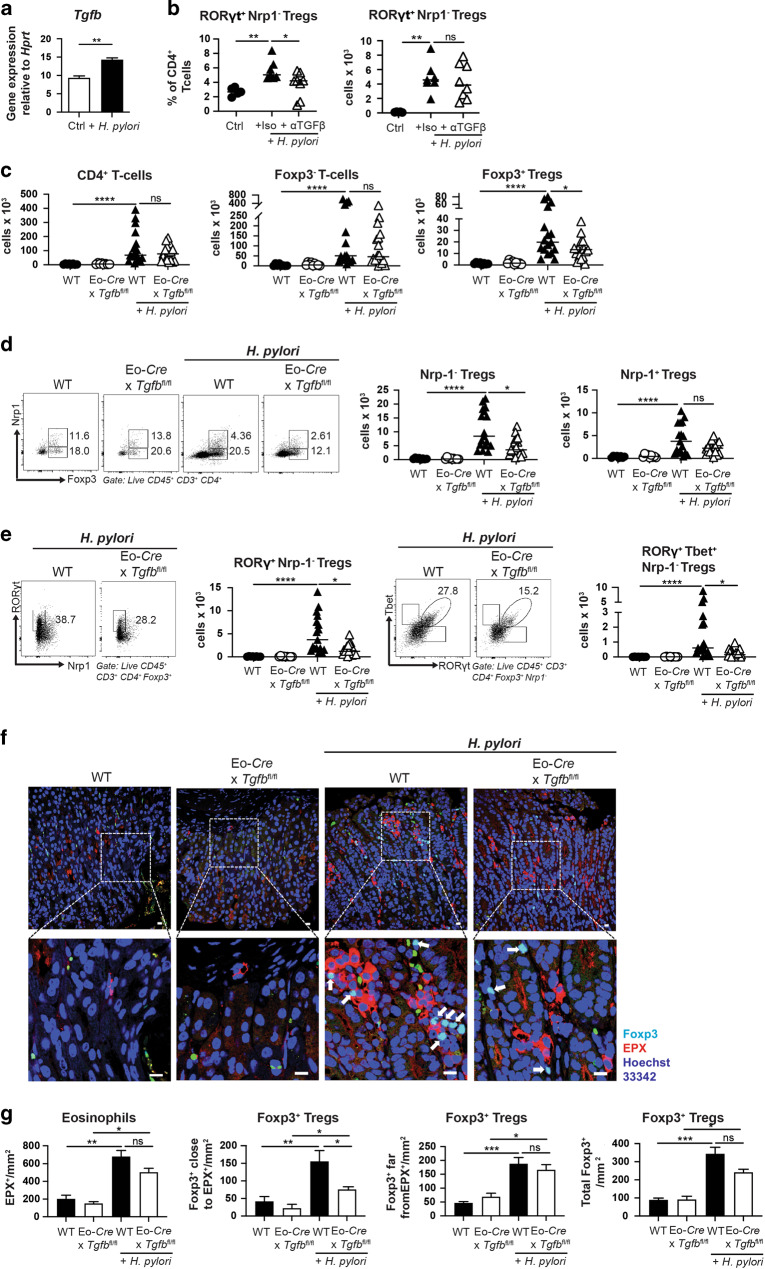
Fig. 3. TGF-β production by eosinophils is required for Treg accumulation in gastrointestinal tissues during chronic infection with H. pylori and H. hepaticus.
a Eosinophils sorted from the spleens of IL-5tg mice were exposed to live H. pylori PMSS1 at a multiplicity of infection of 10 for 6 h, and subjected to Tgfb-specific qRT-PCR. b Wild-type C57/BL6 mice were infected with H. pylori strain PMSS1 for 6 weeks, and treated with twice-weekly doses of 250 μg anti-TGF-β neutralizing or isotype control antibody. The frequencies of RORγt+ Nrp-1− Tregs among CD4+ T-cells, and their absolute counts are shown. Data are from one representative study of two. c–e Eo-Cre x Tgfbfl/fl mice and their wild-type littermates were infected with H. pylori strain PMSS1 for 6 weeks. Absolute counts of all gastric lamina propria CD4+ T-cells, CD4+ Foxp3− conventional T-cells and CD4+ Foxp3+ Tregs are shown in c of infected Eo-Cre x Tgfbfl/fl mice and WT littermates relative to uninfected age-matched controls. Absolute counts of gastric Foxp3+ Nrp-1− Tregs, Foxp3+ Nrp-1+ Tregs, RORγt+ Nrp-1− Tregs and RORγt+ T-bet+ Nrp-1− Tregs of the same mice are shown in d and e alongside representative FACS plots. Data in c–e are pooled from two independent studies. f, g Immunofluorescence microscopy of EPX-positive eosinophils and of Foxp-3-positive Tregs in the gastric mucosa of H. pylori-infected and uninfected mice of the indicated genotypes (scale bar: 10 μm). White arrows point to Foxp3+ Tregs. The quantification of eosinophils, of Foxp3+ Tregs in close proximity, of Foxp3+ Tregs distant from eosinophils, and of all Tregs, all per mm2, as determined by automated quantification, are shown for 5–7 mice per group in g. Statistical comparisons were performed by Mann–Whitney (two groups) or Kruskal–Wallis (more than two groups) test followed by Dunn’s post hoc test. *p < 0.05, **p < 0.01, ***p < 0.001, ****p < 0.0001, ns not significant.

