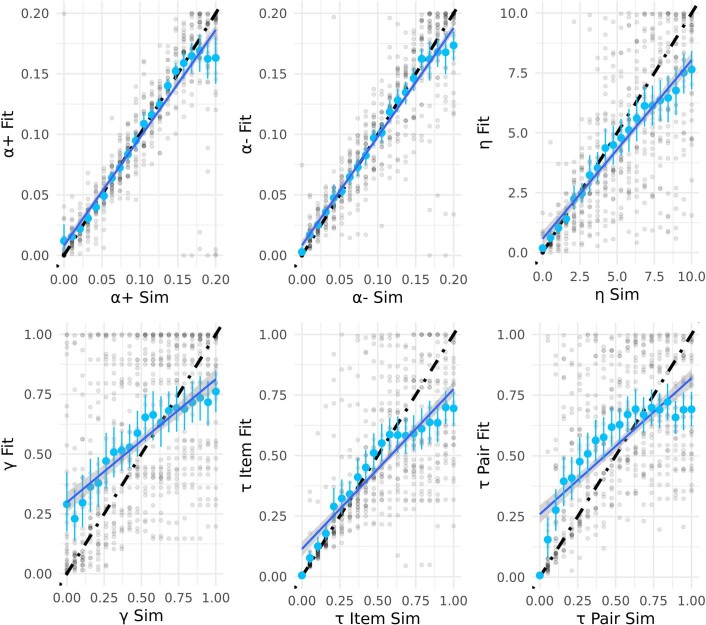
Extended Data Fig. 8. Detailed parameter recovery results for the individual parameters.
The parameter values used to simulate choice data are plotted on the x-axes and the parameter estimates obtained from fitting the model to the simulated data are plotted on the y-axes. Light blue: mean recovered parameter values with bootstrapped 95% confidence intervals. Dark blue line shows linear fit. Results from individual recovery runs are shown as half-transparent black dots.

