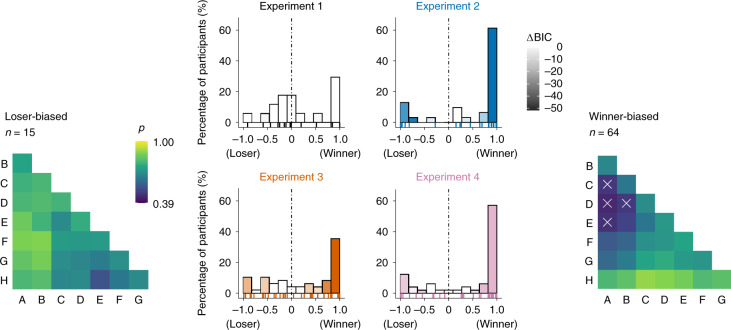
Fig. 5. Winner/loser asymmetries in individual participants.
Centre, histograms of the participants in each experiment sorted according to normalized model-estimated asymmetry: (α+ − α−)/|(α+ + α−)|. Saturation of the bars indicates improvement in model fit (ΔBIC; darker colours indicate greater improvement) compared with the corresponding symmetric model (that is, Q1 in Exp. 1 and Q1* + P in Exps. 2–4). No improvements can be seen in Exp. 1, where symmetric model Q1 provided the best fit (see also Fig. 3e). The raster plots on the bottom of each panel show individual participant results. The majority of participants (n = 79 of 128) in the partial-feedback experiments (Exps. 2–4) showed strongly asymmetric updating either of winning or of losing items, with clear improvements in model fit. Left, mean choice behaviour of participants that were strongly biased towards losers (leftmost bars in the centre plots, Exps. 2–4). p, proportion of correct choices. Right, same as left, for participants strongly biased towards winners (rightmost bars in the centre plots). The white crosses indicate choice accuracies below chance (<0.50).

