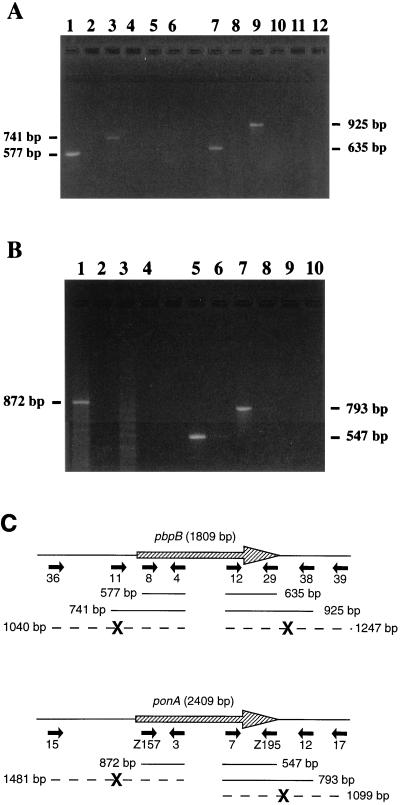
FIG. 1.
Analysis of transcription of pbpB and ponA from L. interrogans strain Verdun by RT-PCR. A sample of each reaction mixture was analyzed on a 1.75% agarose gel with TBE (90 mM Tris, 90 mM borate, 2 mM EDTA [pH 8]) buffer. Lanes with even numbers correspond to negative controls without RT. The size of the amplified products is indicated. (A) RT-PCR for pbpB and adjacent regions. Four reactions were performed with primers internal to the pbpB ORF: primers 4 and 8 (lanes 1 and 2) and primers 12 and 29 (lanes 7 and 8). The other reactions were performed with primers outside the ORF in combination with primers internal to the ORF: primers 4 and 11 (lanes 3 and 4), primers 4 and 36 (lanes 5 and 6), primers 12 and 38 (lanes 9 and 10), and primers 12 and 39 (lanes 11 and 12). (B) RT-PCR for ponA and adjacent regions. Four reactions were performed with primers internal to the ponA ORF: primers 3 and Z157 (lanes 1 and 2) and primers 7 and Z195 (lanes 5 and 6). The other reactions were performed with primers outside the ORF in combination with primers internal to the ORF: primers 3 and 15 (lanes 3 and 4), primers 7 and 12 (lanes 7 and 8), and primers 7 and 17 (lanes 9 and 10). (C) Diagram showing the location of the RT-PCR primers and products of transcription of pbpB and ponA from L. interrogans strain Verdun. The primers (Table 2) are indicated by solid arrows. A thin line shows the presence of a transcript with its length in base pairs. A large boldface X interrupting a broken line indicates the absence of transcript.

