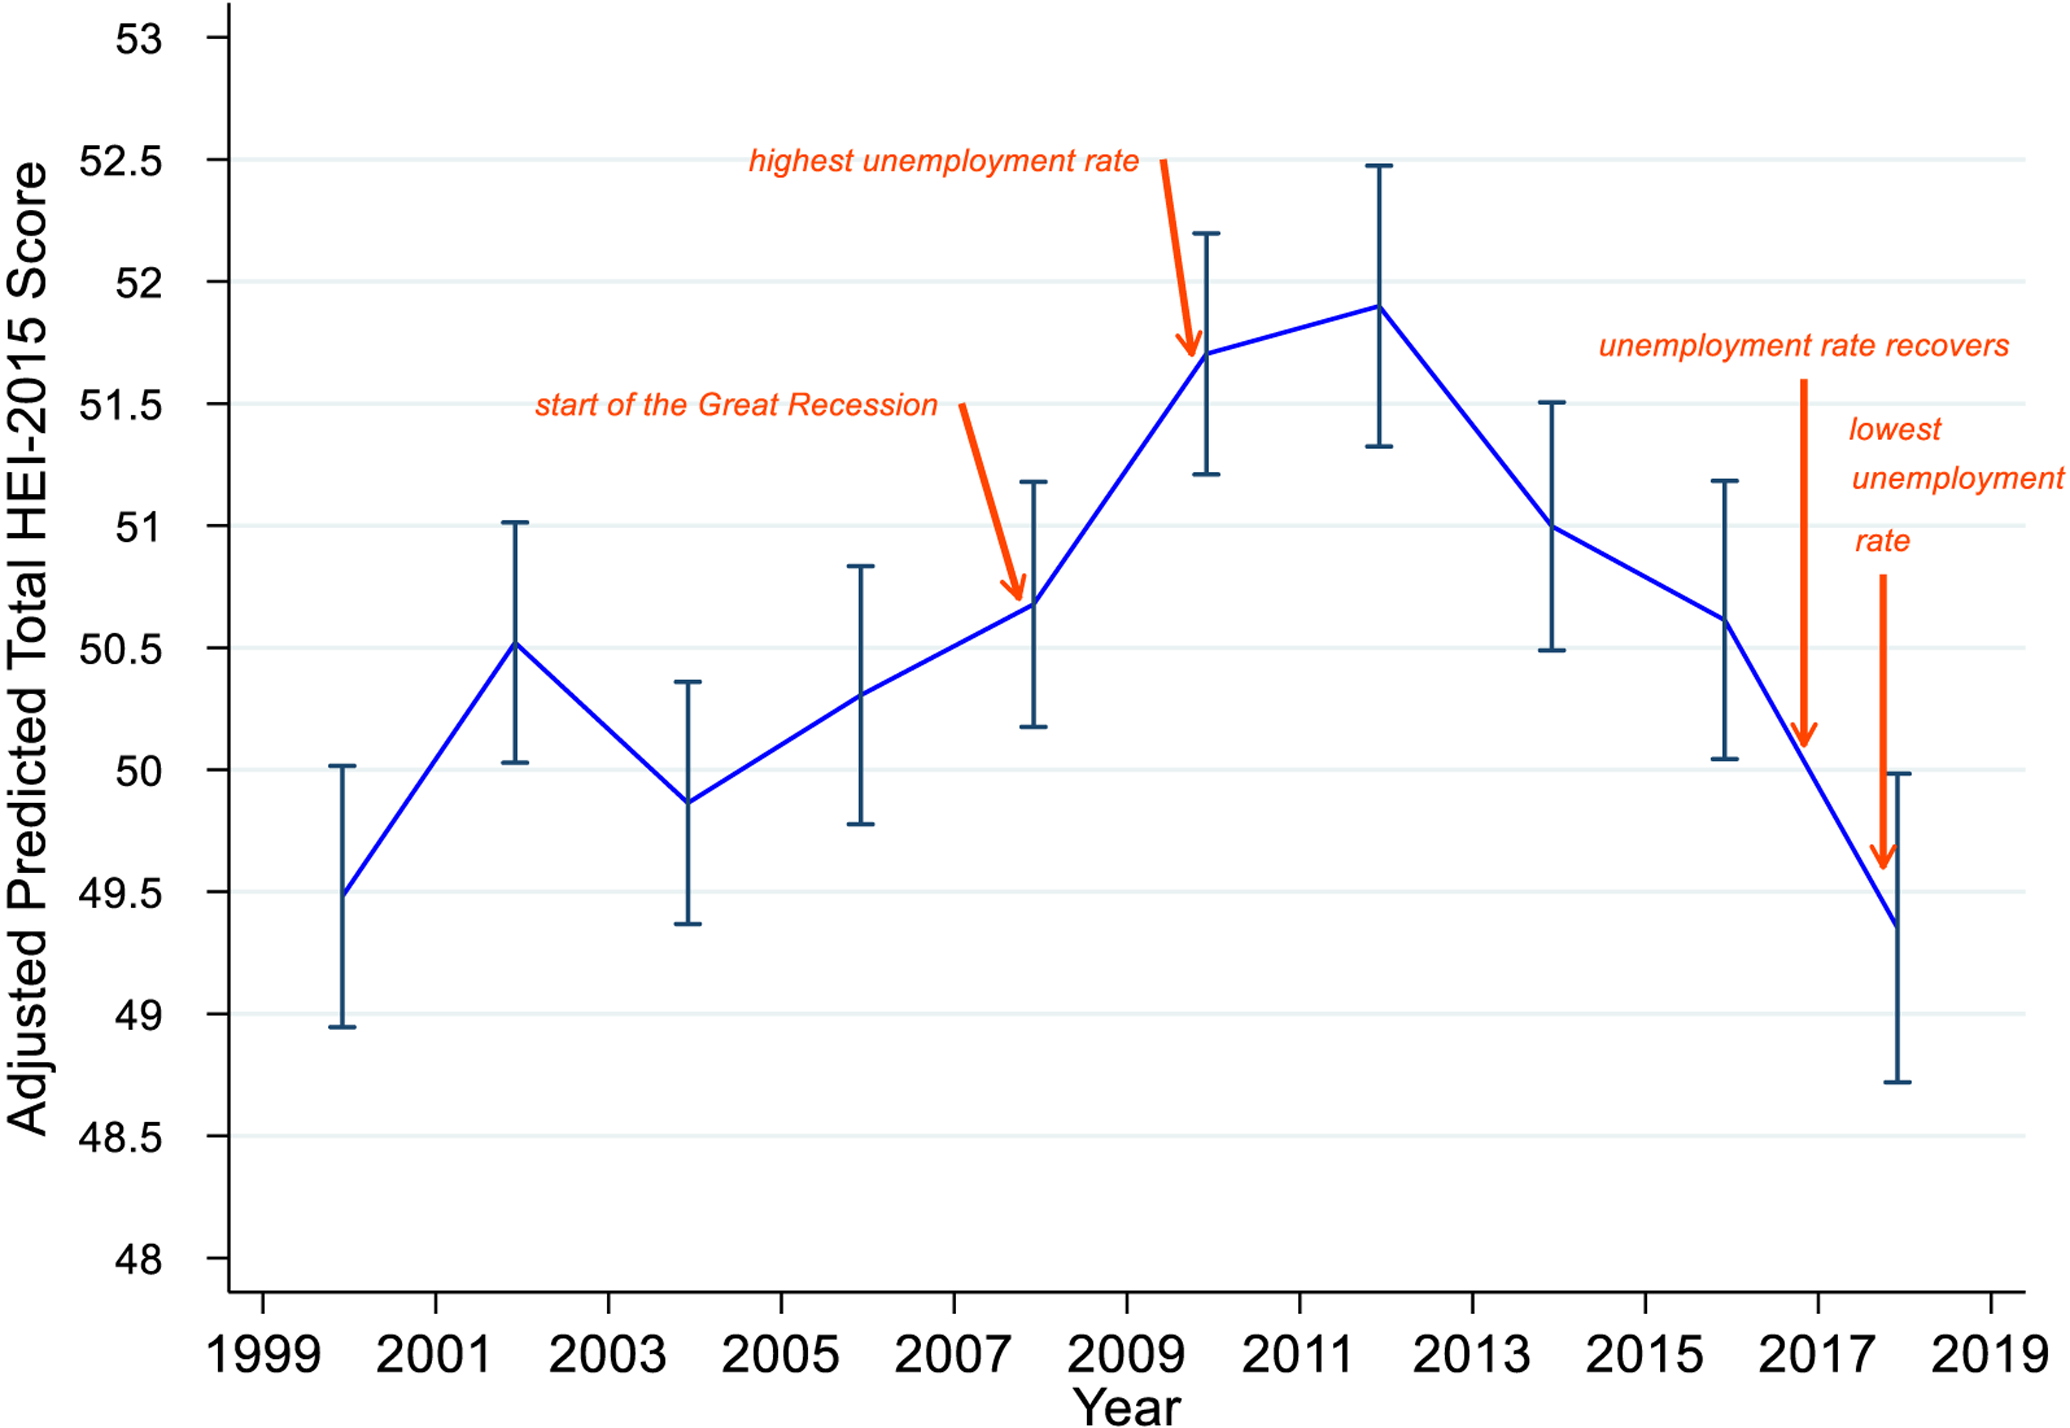
Figure 1:

The Adjusted Predicted Total HEIa-2015 Score Trend and 95% Confidence Intervalb using the National Health and Nutrition Examination Survey, 1999–2018
a HEI = Healthy Eating Index
b predicted values and their 95% confidence intervals are from weighted ordinary least squares regression using margins command in Stata, controlling for sex, age group in years (18–39,40–59,60 or above), race/ethnicity (Non-Hispanic White, Hispanic, Non-Hispanic Black, and other race), and educational level (less than high school, high school graduate/ General Equivalency Diploma, some college/associates (AA) degree or higher)
