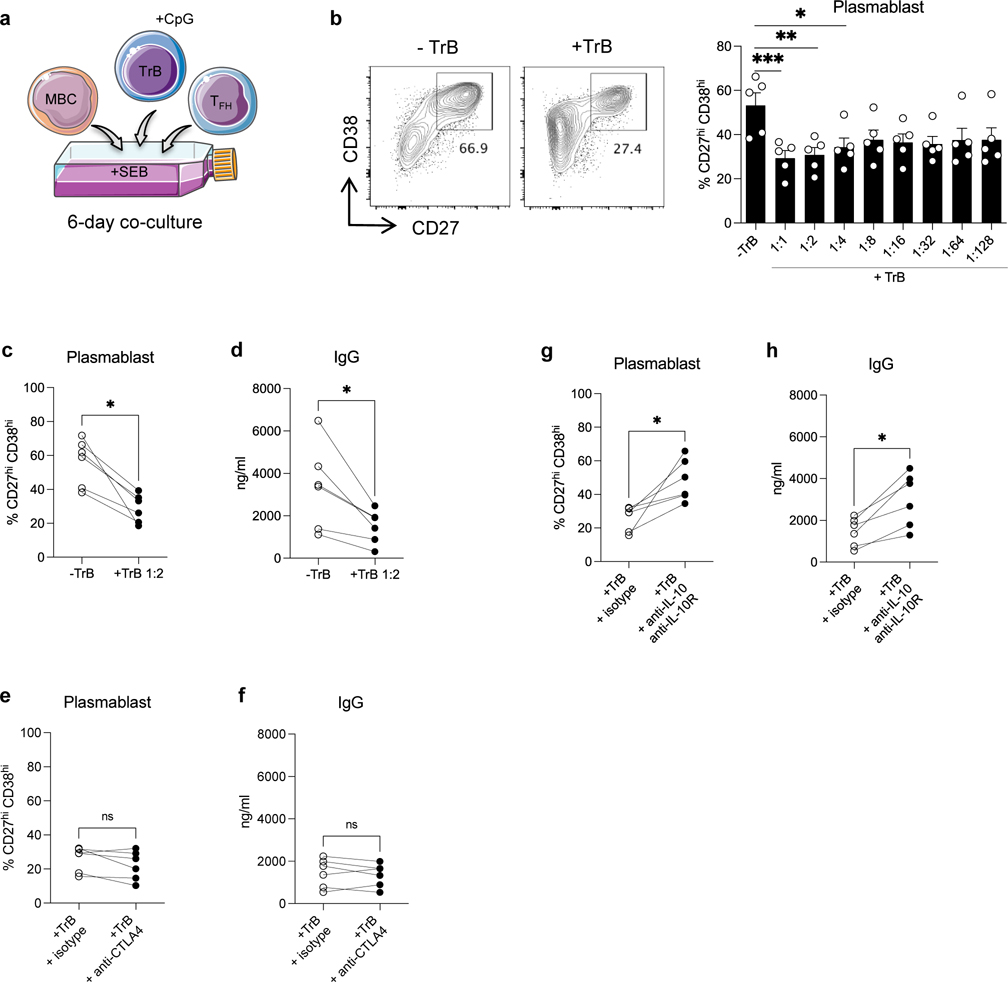
Figure 6. Analyses of TrB capacity to suppress TFH-B cell interactions in vitro.
(a) Schematic representation of sorted MBCs (CD19+CD4−CD38loCD27+) and TFH (CD19−CD4+CD25loCD127+CD45RO+CXCR5+) co-cultured with autologous CpG-pre-activated TrB (CD19+CD4−CD24hiCD38hi) from HC, in the presence of SEB (6 days). (b) Representative examples of flow cytometry analysis of CD27hiCD38hi plasmablasts obtained after 6 days of TFH-B co-cultures with or without TrB at 1:2 ratio. Bar plot of percentages of CD27hiCD38hi plasmablasts after 6 days of TFH-B co-cultures with or without supplementation of TrB from 1:1 to 1:128 ratio; N=5 per condition. (c) Percentages of CD27hiCD38hi plasmablasts (N=6), and (d) amount of IgG in supernatants (N=6) after 6 days of TFH-B co-cultures with or without supplementation of TrB at 1:2 ratio. TrB were pre-incubated with anti-CTLA4 antibody or isotype-matched control, then added to TFH-B co-cultures at 1:2 ratio. (e) Percentages of CD27hiCD38hi plasmablasts (N=6), and (f) amount of IgG in supernatants (N=6) after 6 days of co-cultures. TrB were pre-incubated with anti-IL-10 plus anti-IL-10R antibodies or isotype-matched control, then added to TFH-B co-cultures at 1:2 ratio. (g) Percentages of CD27hiCD38hi plasmablasts (N=6), and (h) amount of IgG in supernatants (N=6) after 6 days of co-cultures. Friedman test with Dunn’s post-test for panel b. Wilcoxon matched-pairs signed rank test for panel c, d, e, f, g and h. *P < 0.05; **P < 0.01; ***P < 0.001; ****P < 0.0001. Each dot represents one subject and horizontal lines of bars are mean values ± SEM.

