
Figure 4.
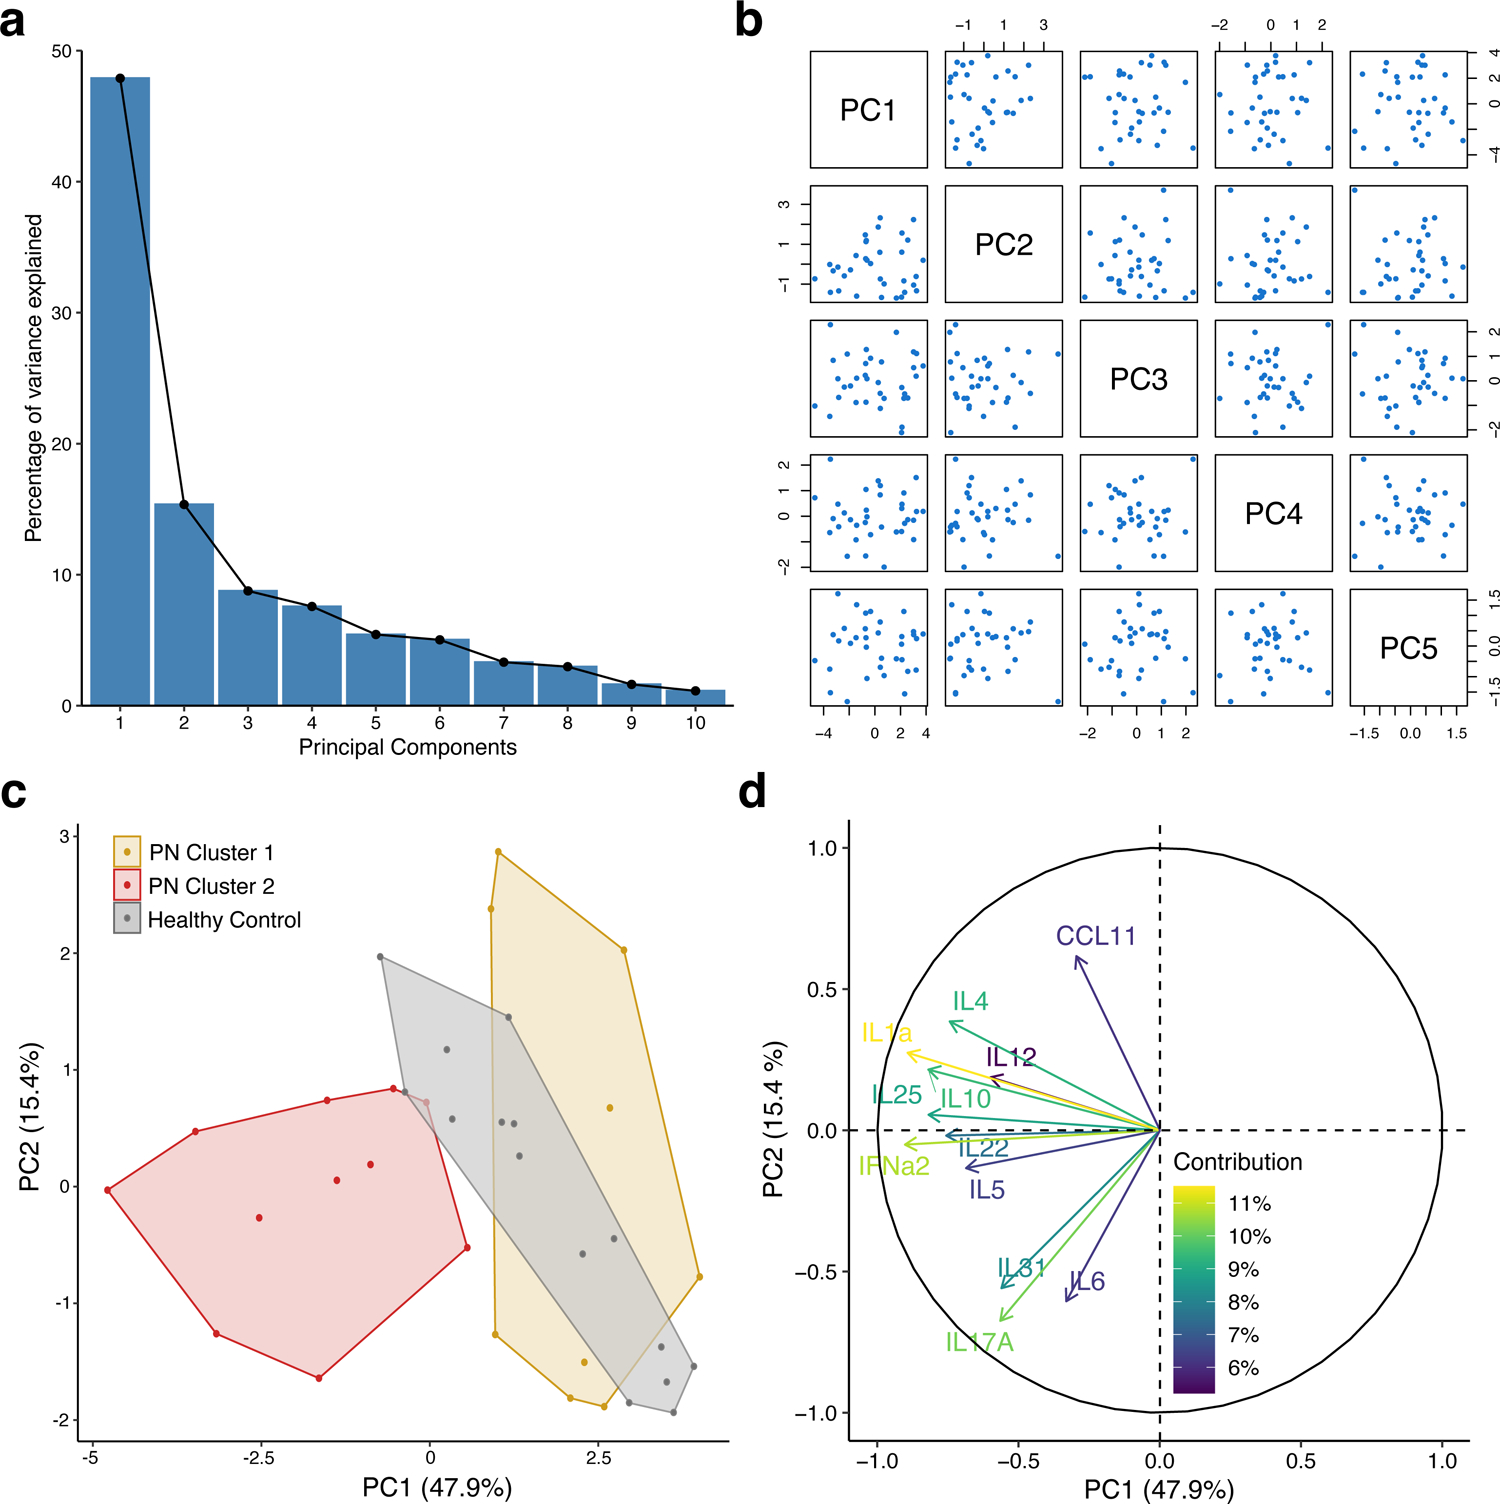
Internal validation of prurigo nodularis (PN) clusters with principal component analysis. (a) Scree plot of principal components. (b) Pairs plot of principal components. (c) Cluster plot PN and healthy patients on the first two principal components. (d) Loadings plot of biomarkers with percent contribution to the first principal component.