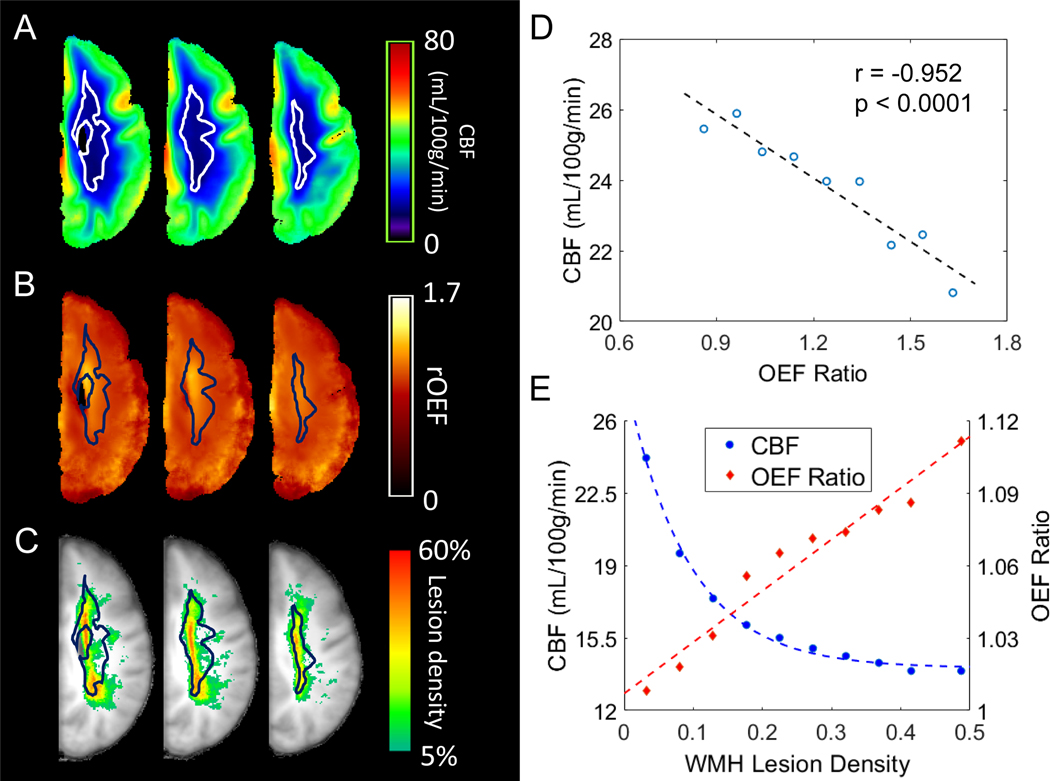
Figure 3. White matter hyperintensities (WMH) cluster in the physiologic watershed.
Average cerebral blood flow (CBF) map (A), average oxygen extraction fraction (OEF) ratio map (B), and WMH lesion density map (C) were calculated from all 42 subjects. The watershed (outlined, panels A-C), delineated by the lowest 10th percentile CBF in a young healthy cohort (Supplementary Figure I)has remarkable overlap with the CBF nadir (A), the region of highest OEF elevation (B) and the highest density of WMH in the older study cohort (C). White matter voxels with group average OEF ranging from 0.8 to 1.6 were grouped into 8 bins with an increment of 0.1 and a final bin of OEF>1.6. Average CBF and OEF were obtained from these grouped voxels (D). A univariate linear regression demonstrates the inverse spatial association between CBF and OEF. White matter voxels with lesion density ranging from 0–45% were grouped into 9 bins with an increment of 5% as well as a final bin of >45%. Average lesion density, CBF and OEF were obtained from these grouped voxels (E). The relationship between CBF and WMH lesion density is best described by an exponential curve, while OEF and WMH lesion density demonstrate a linear relationship.

