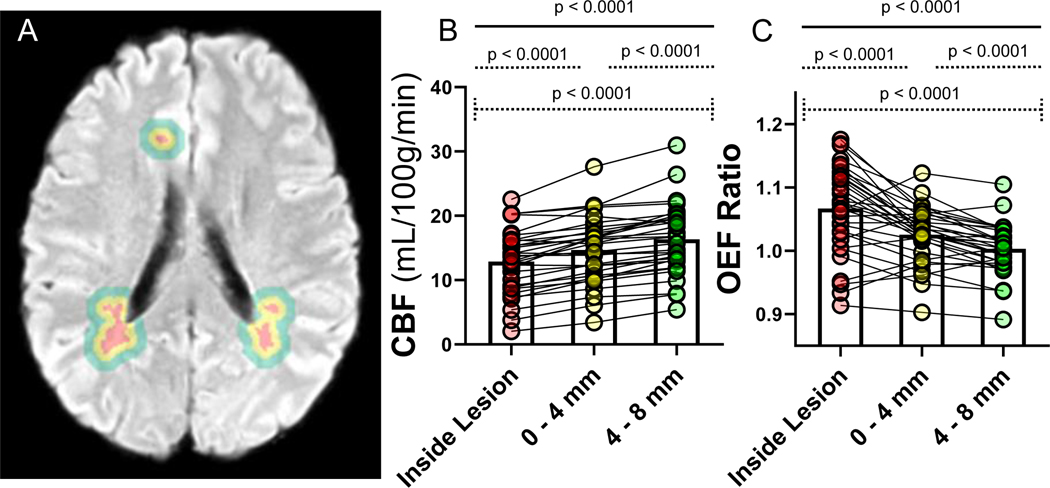
Figure 4. Cerebral blood flow (CBF) and oxygen extraction fraction (OEF) measurements in concentric contours surrounding lesions suggest hypoxia-ischemia in proximity to white matter hyperintensities (WMH).
WMH (red) and concentric contours, measuring 0–4 mm (yellow), and 4–8mm (green), surrounding each lesion were generated by dilating the WMH mask in three dimensions for each ROI, excluding cerebrospinal fluid and gray matter. Only participants with >1 cc of WMH were included in this analysis. (A). Comparison of CBF (B) and OEF (C) values across the contours within individuals are shown (spaghetti plots). CBF was lowest inside the lesions and increased with each contour (B). OEF was highest inside the lesions and decreased with each contour (C).

