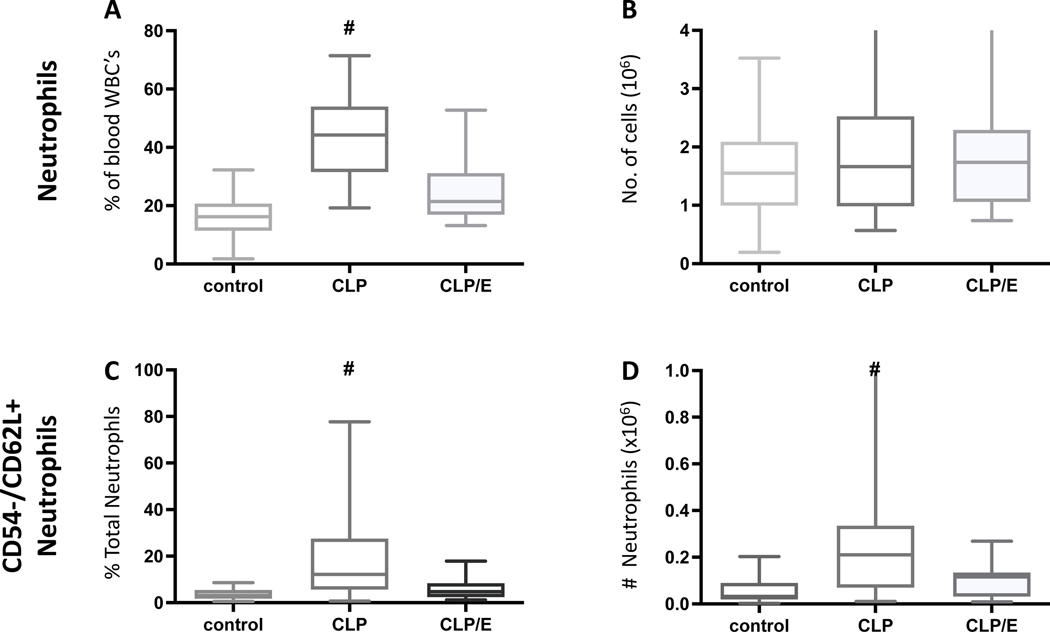
Figure 4: Changes in neutrophil proportion, numbers and phenotype indicate effective source control.
Mice underwent sham treatment (n=36) or CLP procedure with (n=18) and without (n=33) surgical source control (CLP/E) after 3h as described in the method section (A-D). After 24 hours post CLP intervention, whole blood analyzed by flow cytometry. Neutrophil A) proportion and B) numbers were determined. were identified as Ly6G positive cells and their relative and absolute number was assessed (A, B). The activated neutrophil C) proportion and D) number were determined. Data are presented as a box plot covering the first, second (median), third quartile, and 5th + 95th percentile. # p<0.05 vs sham and CLP/E.

