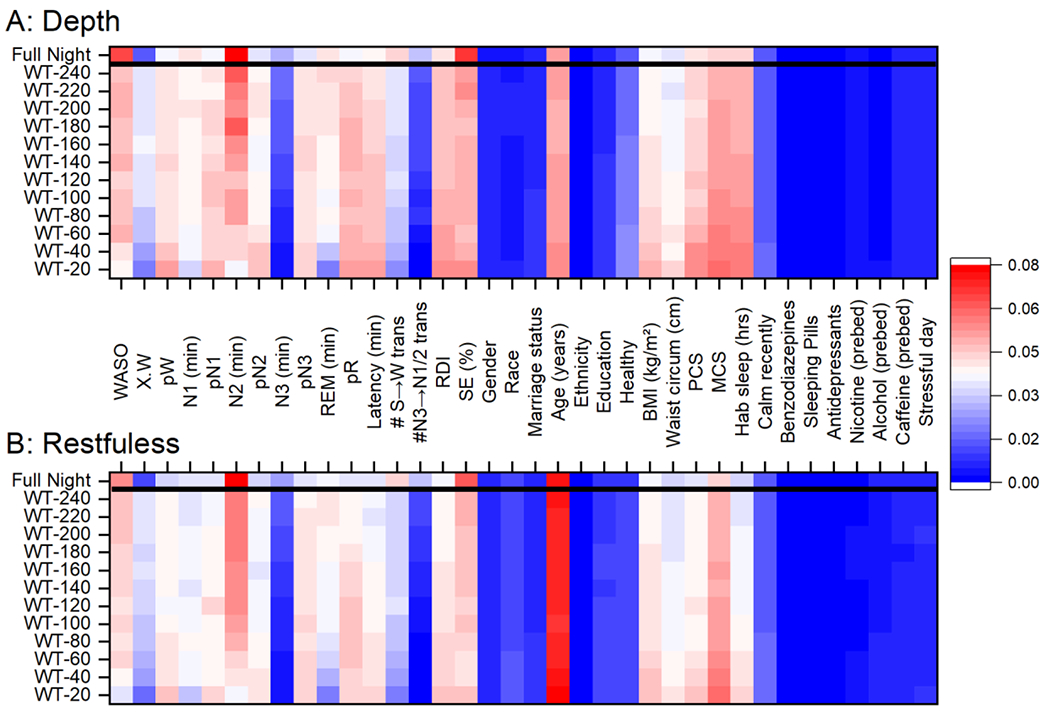
Figure 6.

A heat map of the relative amount of variance explained by different predictor variables for self-reported sleep depth (A) and restedness (B) in independent Random Forest models. Percent of variance explained is color coded as indicated. Each horizontal line represents a different amount of data from the full night of data to sequential parsing of the data starting at wake time (WT) (e.g., WT-120 is based on data between wake time and 120 minutes before wake time). Abbreviations: WASO: wake after sleep onset; X.W: average probability of wake during scored wake epochs multipled by the total duration of wake epochs; pW: average probability of wake; pN1: average probability of N1; pN2: average probability of N2; pN3: average probability of N3; REM: rapid eye movement sleep; pR: average probability of REM; Latency: sleep onset latency; #S→W trans: number of transitions between sequential epochs scored as sleep and then wake; N3→N1/2 trans: number of transitions between sequential epochs scored as N3 and then either N1 or N2 sleep; RDI: respiratory distress index; SE: sleep efficiency; BMI: body mass index; PCS: Physical Component Scale; MCS: Mental Component Scale; Hab sleep: habitual sleep length.
