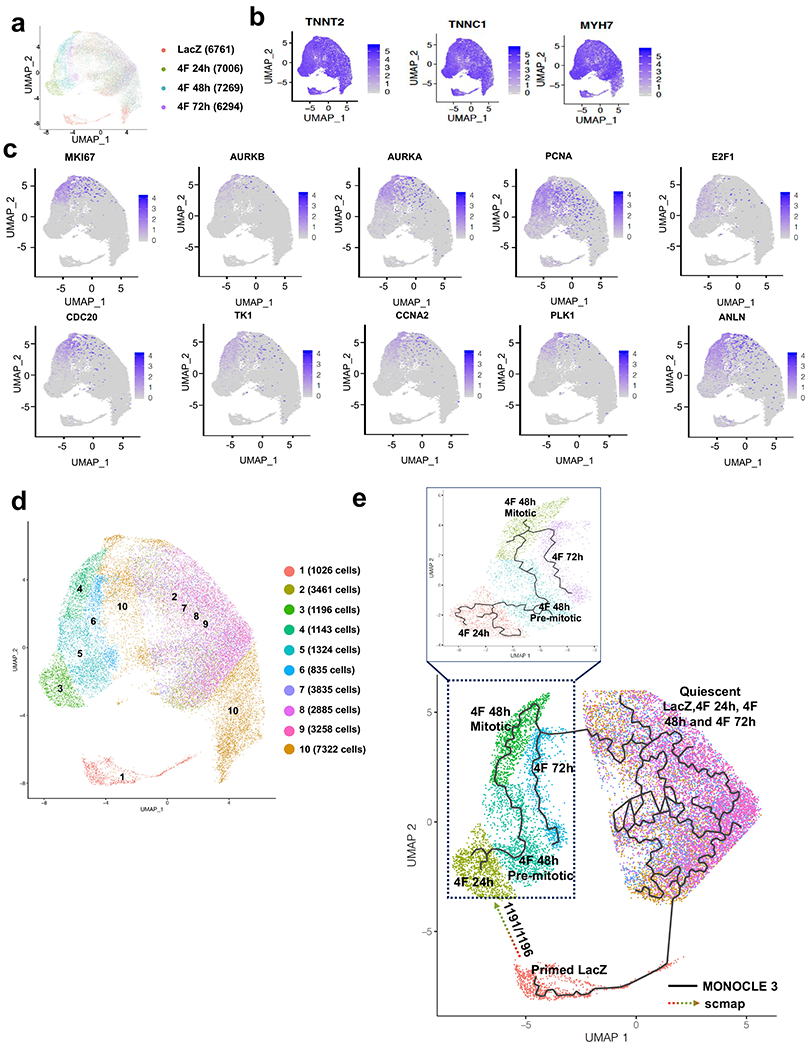
Fig. 3. Single-cell RNAseq identifies a unique mitotic subpopulation that appears at 48h post-infection with 4F.

(a) UMAP plots considering global gene expression for all single cardiomyocytes sequenced from LacZ (control group) and 4F-overexpressing cardiomyocytes at 24, 48 h, or 72 h after viral transduction (approximately 7000 cells/sample). (b) All cells show high expression of the cardiac markers, TNNT2, TNNC1, and MYH7, indicating the cardiomyocytes’ purity. (c) A unique cell population appears only at 48 h post-infection with 4F, which express mitotic/cytokinesis genes; this population was identified as the mitotic population that expresses high levels of the G2/M markers (Ki67, Aurora Kinase A and B, PCNA, E2F1, CDC20, TK1, CCNA2, PLK1, and ANLN). (d) re-clustering the cells according to their expression of the mitotic genes and location of the subpopulation of cells associated with a given time-point in the UMAP space. Consistent with our published data, the mitotic population represents ~15% of the total cardiomyocyte population within the 48 h sample. (e) Trajectory analysis using MONOCLE (solid line) and scmap (dotted arrow) algorithms to predict the pseudo time trajectory of each unique population at each time point.
