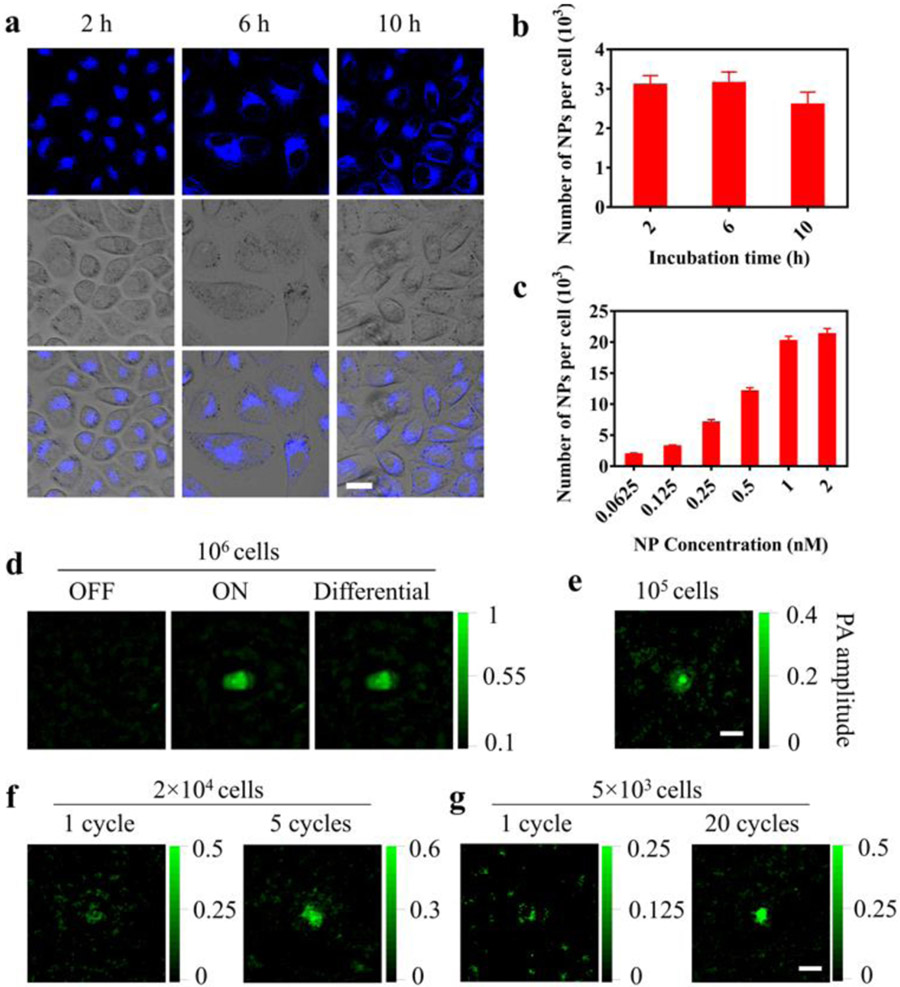
Figure 3.
Cell labeling with the nanoprobe and PAPSI in the cells. a) Fluorescence images of the HeLa cells incubated with the nanoprobe (0.125 nM) for 2, 6, or 10 h at 37 °C. Scale bar: 20 μm. b, c) Number of nanoprobes taken up by the cells determined by ICP-MS at b) different incubation time (2–10 h) with the same probe concentration (0.125 nM) or c) different probe concentrations (0.0625–2 nM) with the same incubation time (6 h). Results are presented as Mean ± SD (three wells per group in 6-well cell culture plates). d-g) PAPSI images of labeled HeLa cells (2 × 10⁴ NPs per cell) in 10 μL PBS (pH 7.4) in a transparent plastic tube at indicated cell number. d): 106; e): 105, f): 2 × 10⁴; g): 5 × 10³ with indicated PAPSI cycle number. Scale bars: 2 mm.

