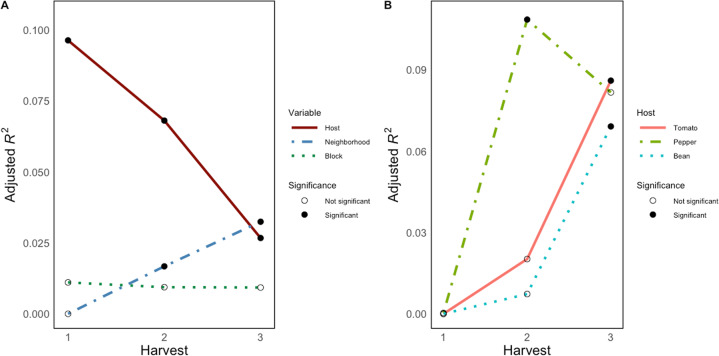
Fig. 3. The effects of host identity on bacterial community composition decrease through time while neighborhood effects increase and vary by host plant species.
A Adjusted R2 values (y-axis) are the result of PERMANOVA analyses on Bray Curtis dissimilarities for each harvest, accounting for sample number and degrees of freedom from slight differences in sample number. See Table 1 for pre-adjusted R2 values. The effect of host identity (solid maroon line), the effect of the neighborhood (blue dot-dash line), and the effect of the experimental block (green dotted line) are shown. The harvest time point is shown on x-axis. Filled circles indicate statistical significance (p < 0.05), while open circles represent statistically insignificant effects (p > 0.05). B Host plant species experience neighborhood effects on phyllosphere bacterial communities differently through time. Adjusted R2 values (y-axis) and harvest time point (x-axis) are as described for plot A. Tomato hosts (solid red line), pepper hosts (light green dot-dash line), and bean hosts (light blue dotted line) are shown. Filled circles indicate statistical significance (p < 0.05), while open circles represent statistically insignificant effects (p > 0.05).

