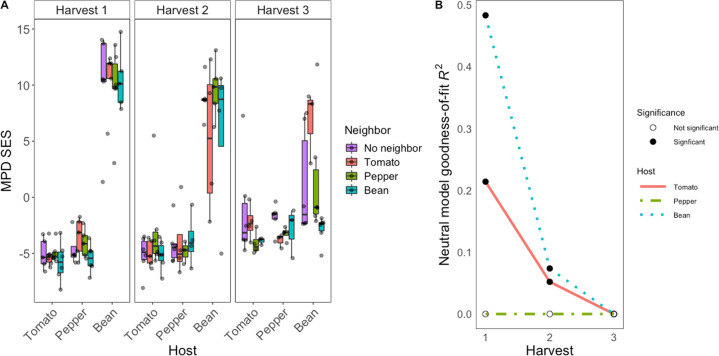
Fig. 5. Bacterial leaf surface community assembly processes differ between plant hosts, suggesting differences in host filtering.
A Standardized effect size (SES) of mean pairwise distance (MPD) of phyllosphere communities split by the host (x-axis), neighbor (box color), and harvest time point (panels 1, 2, or 3). SES = (MPDobs − MPDnull)/SD(MPDnull), whereby values below 0 suggest phylogenetic clustering. B The fit of a neutral model declines through time but differs strongly by host identity. Neutral model goodness-of-fit values (R2, y-axis) at each harvest (x-axis) for tomato (solid red line), pepper (green dot-dashed line), and bean (blue dotted line). Filled circles indicate statistical significance, open circles indicate not significant (negative or 0 goodness-of-fit values).

