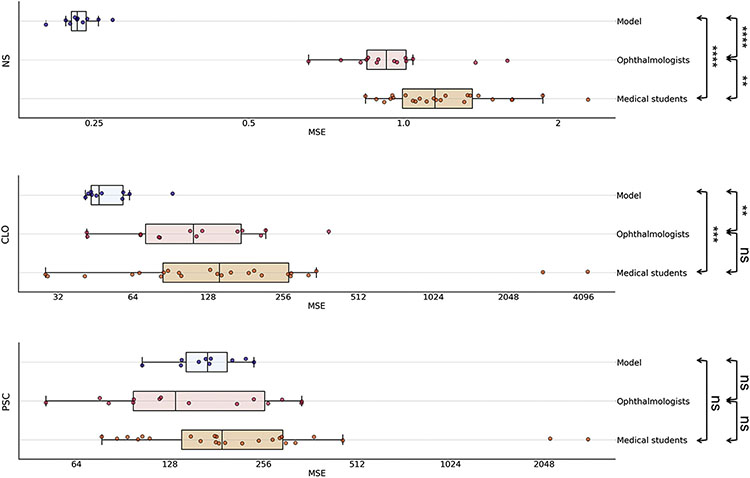
Figure 3.
Box plots showing the mean squared error (MSE) results on a logarithmic scale for the 10 deep learning models, the 14 ophthalmologists, and the 24 medical students for the 3 primary grading variables (NS, 0.9–7.1; CLO, 0%–100%; PSC, 0%–100%). The vertical line of the boxes represents the median MSE score, and the boxes represent the first and third quartiles. The whiskers represent quartile 1 – (1.5 × interquartile range) and quartile 3 + (1.5 × interquartile range). The dots represent the individual MSE result for each model or human grader. ****P ≤ 0.0001; ***P ≤ 0.001; **P ≤ 0.01; ns, P > 0.05 (Mann–Whitney U test). CLO = cortical lens opacity; NS = nuclear sclerosis; PSC = posterior subcapsular cataract.

