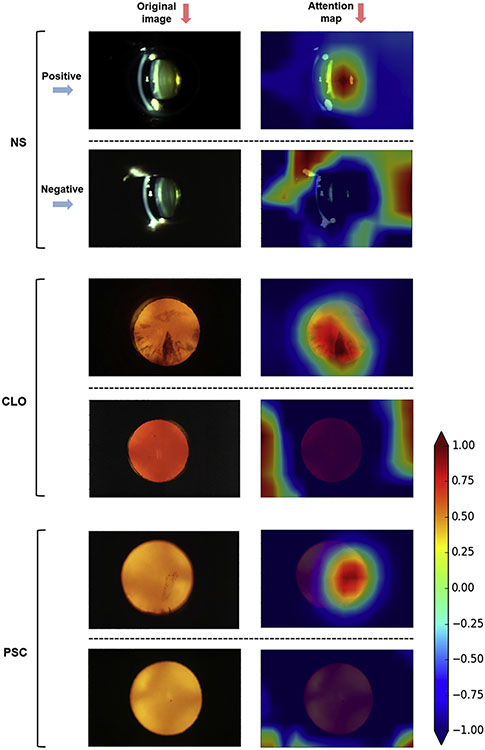
Figure 4.
Deep learning attention maps (right) overlaid on representative retroillumination images and 45-degree slit-lamp images (left). For each of the 3 cataract types (nuclear, cortical, and posterior subcapsular), 1 positive example (above) and 1 negative example (below) are shown (or more severe and less severe for nuclear cataract). For each image, the attention map demonstrates quantitatively the relative contributions made by each pixel to the grading prediction. The heatmap scale for the attention maps is also shown: signal range from −1.00 (purple) to +1.00 (brown). In the positive case of cortical cataract, the areas of high signal corresponded closely to the location and extent of the opacity. In the negative case, no areas of high signal were observed in the lens distribution. In the positive case of PSC, the area of high signal corresponded closely to the location and shape of the opacity (a single vertically elongated plaque). In the negative case, no areas of high signal were observed in the lens distribution. In the severe case of nuclear cataract, the area of high signal corresponded to the location of the lens nucleus. In the mild case, no areas of high signal were observed in the distribution of the lens nucleus. Nuclear sclerosis severe case: reading center grading of 5.3, automated prediction of 5.2. Nuclear sclerosis mild case: reading center grading of 2.5, automated prediction of 2.6. Cortical lens opacity positive case: reading center grading of 41.6%, automated prediction of 43.6%. Cortical lens opacity negative case: reading center grading of 0%, automated prediction of 0%. Posterior subcapsular cataract positive case: reading center grading of 19.8%, automated prediction of 18.6%. Posterior subcapsular cataract negative case: reading center grading of 0%, automated prediction of 0%. CLO = cortical lens opacity; NS = nuclear sclerosis; PSC = posterior subcapsular cataract.

