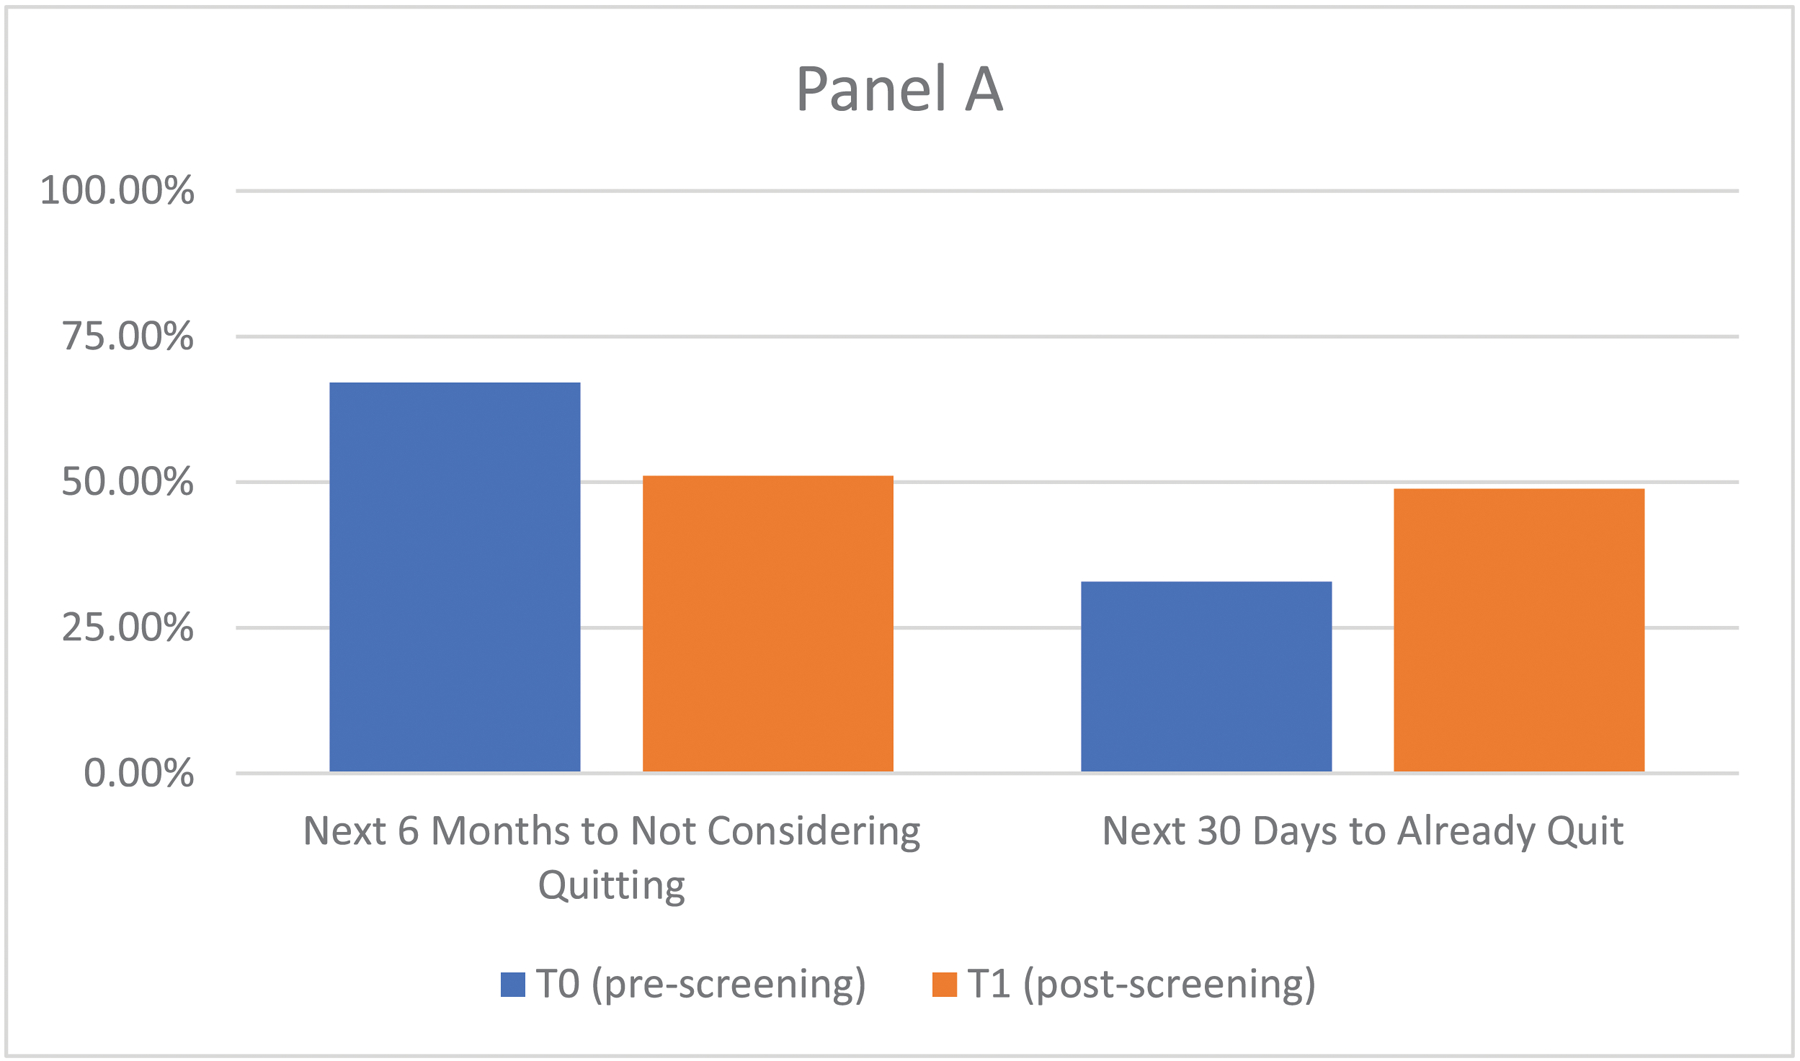
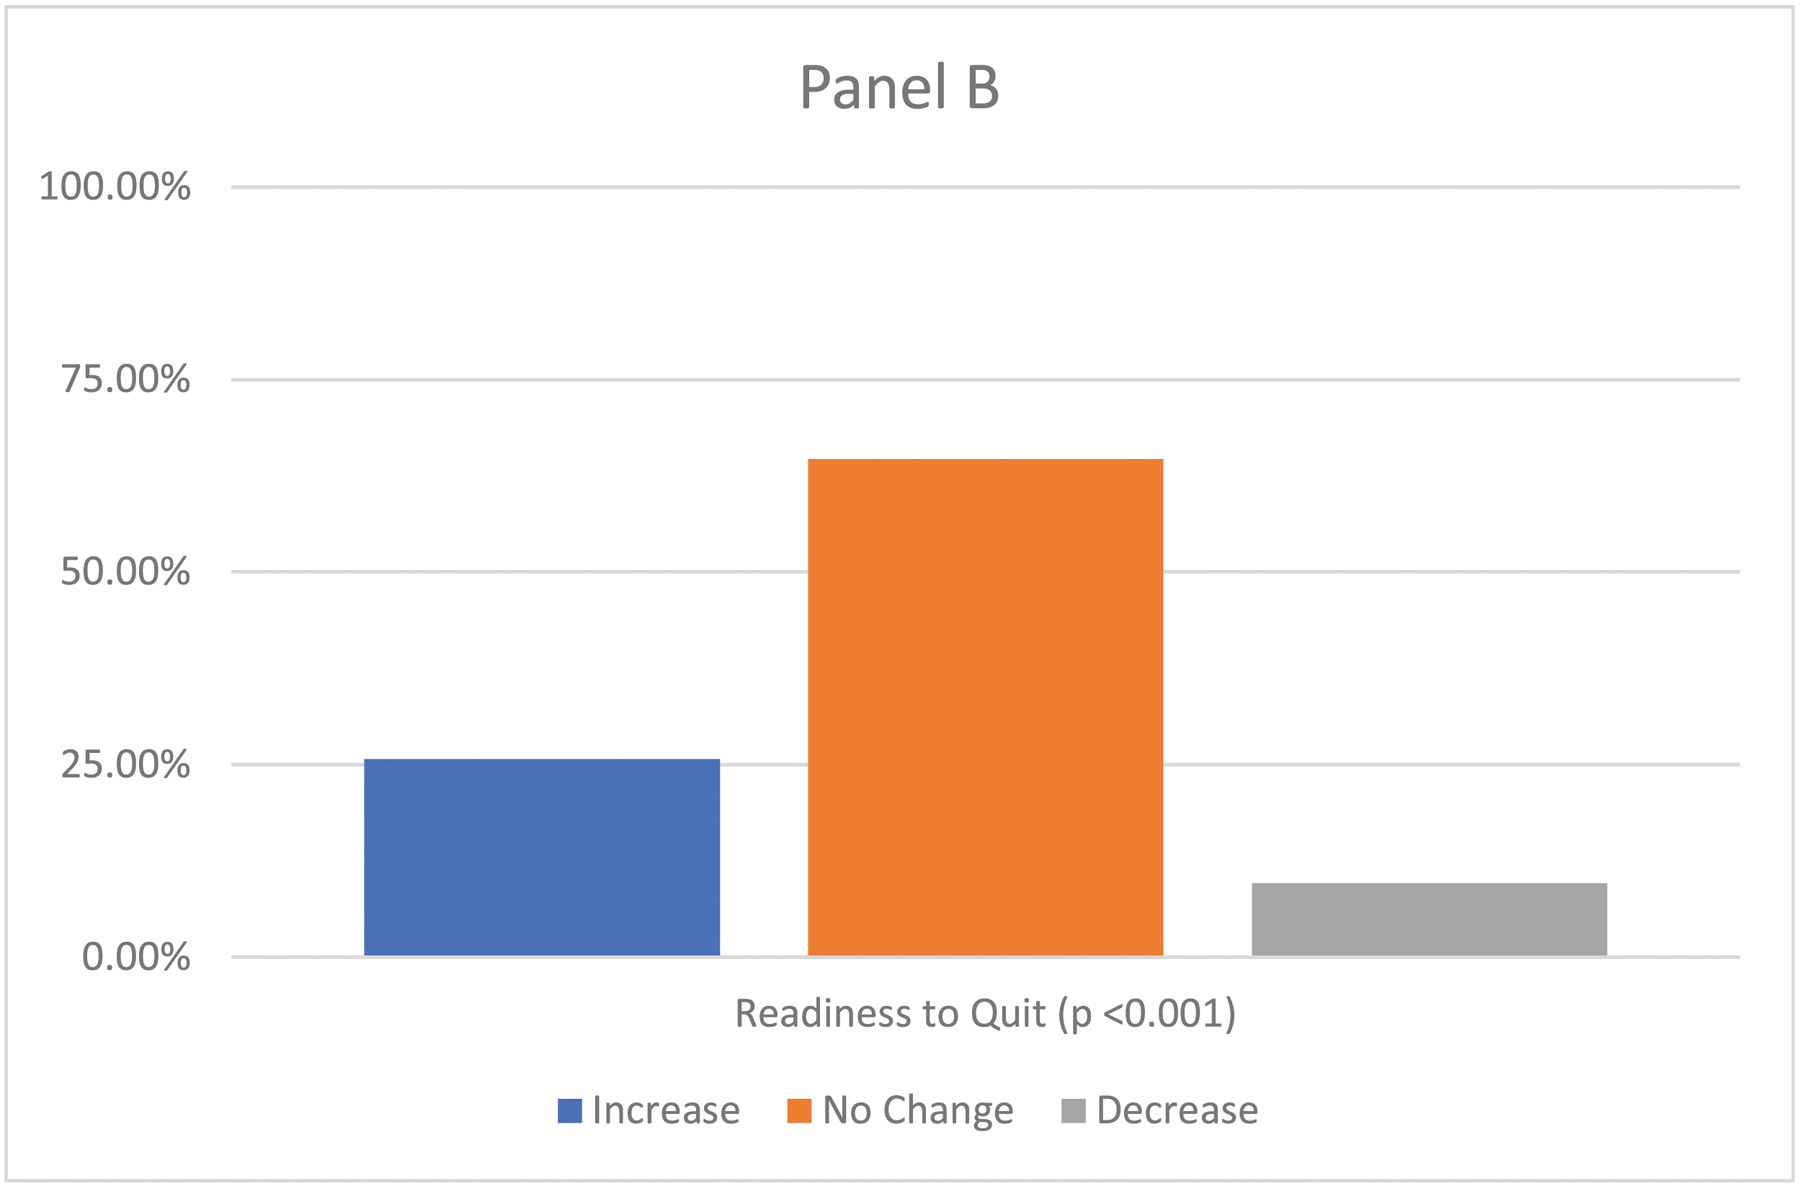
Figure 2.


Change from Pre- to Post-Lung Cancer Screening in Readiness to Quit (N=843)
Note: Panel A shows the T0 (pre-screening) and T1 (post-screening) frequency distribution.
Panel B shows changes between the T0 and T1 on readiness to quit using the McNemar test.)
