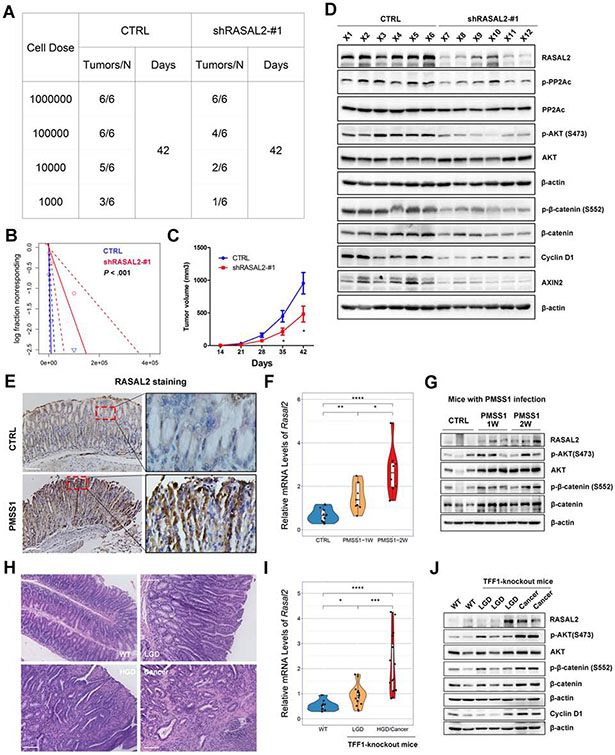
Figure 6. In vivo studies of RASAL2 in gastric tumorigenesis.
(A and B) MKN45 cells with/without RASAL2 knockdown were serially diluted and xenografted into NOD/SCID mice subcutaneously. (A) shows tumor the cell numbers injected and frequency of tumor formation at day 42. (B) displays the probability estimates calculated with Extreme Limiting Dilution Analysis (ELDA) software (http://bioinf.wehi.edu.au/software/elda/). A significant difference in tumor formation capacity was observed between the control and sh-RASAL2 groups. (C) Tumor growth curves for subcutaneous tumor xenografts with shRNA knockdown or control (n = 6 per 1 million cells dose group); *P < .05. (D) Western blots for RASAL2 and its downstream signaling genes for xenograft tumors with/without RASAL2 knockdown (from 1 million cells dose group). (E-G) Immunohistochemistry staining (scale bars, 100μm) of RASAL2 (E), qRT-PCR of Rasal2 (F), and Western blots for RASAL2 (G) and its downstream targets were performed in H. pylori-infected mouse stomach tissues using mouse-adapted H. pylori strain, PMSS1, for 1 week (PMSS1-1W) or 2 weeks (PMSS1-2W) infection. *P < .05, **P < .01, ***P < .001. (H-J) Hematoxylin and eosin (H&E) staining (H, scale bars, 100μm), qRT-PCR of Rasal2 (I), and Western blots for RASAL2 and its downstream targets (J) were performed in TFF1-knockout mouse neoplastic gastric tissues. WT, wide-type mouse; LGD, low-grade dysplasia; HGD, High-grade dysplasia. *P < .05, ***P < .001.

