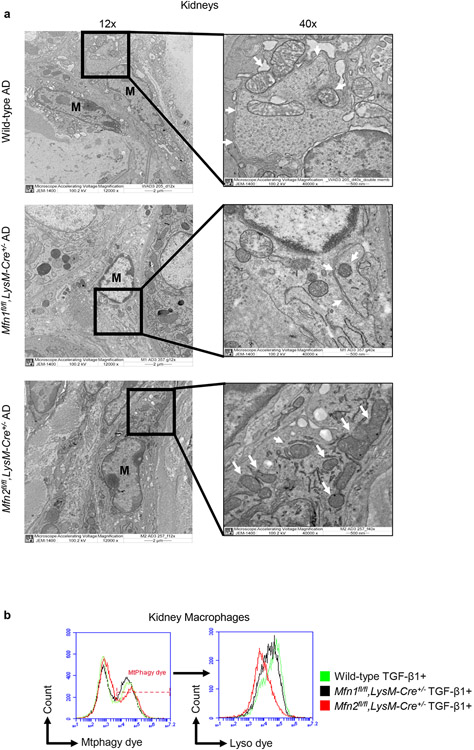
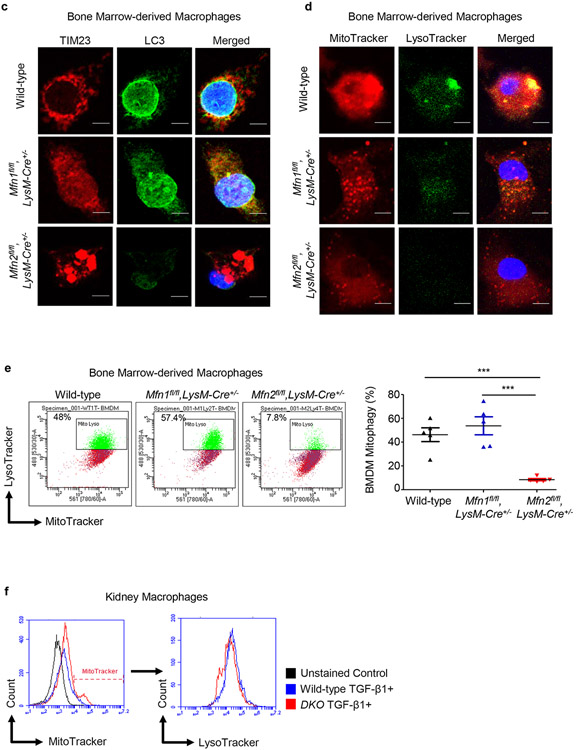
Figure 8. Mitophagy is impaired in Mfn2-deficient macrophages.
a) Representative transmission electron microscopy (TEM) images displaying kidney macrophages (labeled as M; 12,000X magnification; Scale bars: 2 μm) and presence/absence of the double-membrane vesicle containing mitochondria (pointed by arrow, 40,000X magnification; Scale bars: 500 nm) in wild-type, Mfn1fl/fl,LysM-Cre+/−, and Mfn2fl/fl,LysM-Cre+/− mice after 28 days of adenine (AD) diet. b) Representative histograms for the detection of Mtphagy dye stained mitochondria gated for lyso dye positive lysosomes by flow cytometry in kidney macrophages sorted from wild-type, Mfn1fl/fl,LysM-Cre+/−, and Mfn2fl/fl,LysM-Cre+/− mice, cultured in the presence (+) of TGF-β1 (5 ng/ml) for 48 hours. c, d) Representative confocal microscopy images of bone marrow-derived macrophages (BMDM) from wild-type, Mfn1fl/fl,LysM-Cre+/− and Mfn2fl/fl,LysM-Cre+/− mice stained for TIM23 (red), LC3 (green) (c) and MitoTracker (red), LysoTracker (green) (d), mounted with DAPI (blue) containing mountant media. Scale bars: 5 μm. e) Representative flow cytometry plots and analysis showing colocalized signal of MitoTracker (red) and LysoTracker (green) dyes in F4/80+ BMDM from wild-type, Mfn1fl/fl,LysM-Cre+/− and Mfn2fl/fl,LysM-Cre+/− mice. f) Representative flow cytometry histogram showing the mean fluorescence intensity (MFI) of the colocalized signal of MitoTracker (red) and LysoTracker (green) dyes in kidney macrophages sorted from wild-type and Mfn1/Mfn2 double knockout (DKO) mice, cultured in the presence (+) of TGF-β1 (5 ng/ml) for 48 hours. Data are mean ± SEM representative of 3 independent experiments, (n = 5 per group). *P < 0.05, **P < 0.01, ***P < 0.001, analyzed by one-way ANOVA followed by Newman-Keuls post-hoc test.


