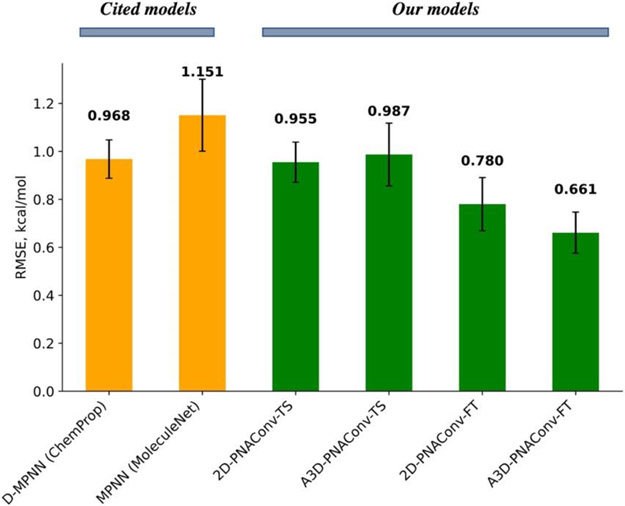
Figure 5.
Performance on the fixed FreeSolv test set by different models. The values atop each bar are the mean RMSE on the test set by 5 runs with different initial weights. The error bars are the standard deviation of the mean across 5 runs. 2D-PNAConv-TS and A3D-PNAConv-TS means we trained PNAConv-based model from scratch using 2D and A3D features, respectively.

