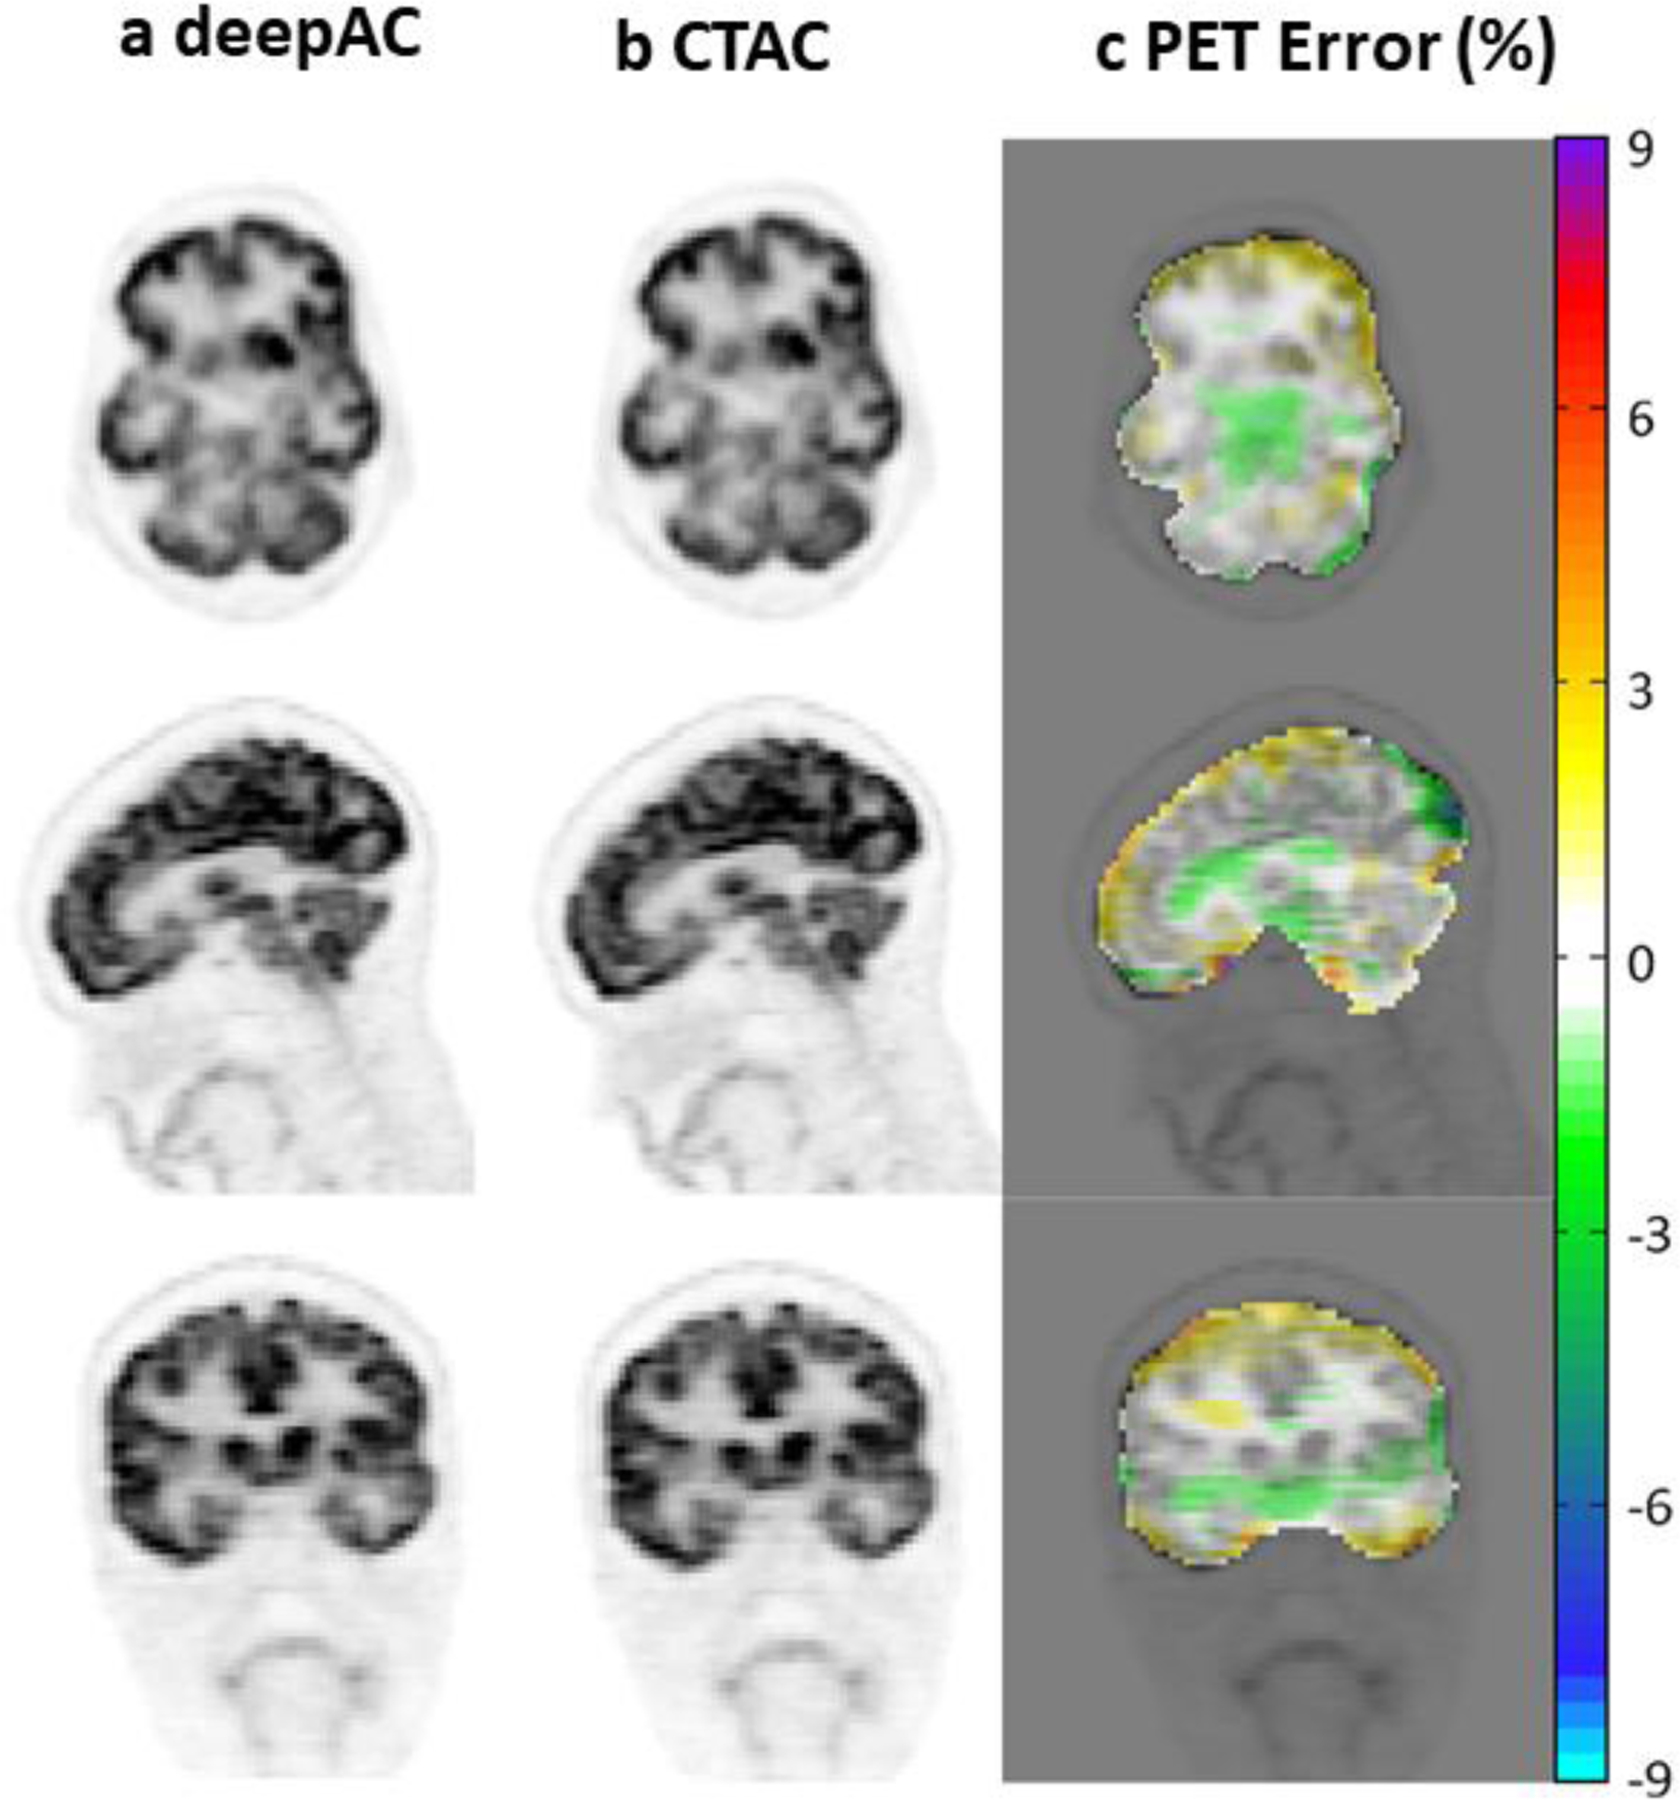
Figure 17.

Comparison of FDG PET scans corrected for attenuation with the DL attenuation image (a) and the actual CT image (b). PET error is the difference between the derived and actual PET image. Adapted with permission from “A deep learning approach for 18 F-FDG PET attenuation correction.”, Liu, Fang, et al., EJNMMI physics 5.1 (2018): 1–15.
