
Figure 19.
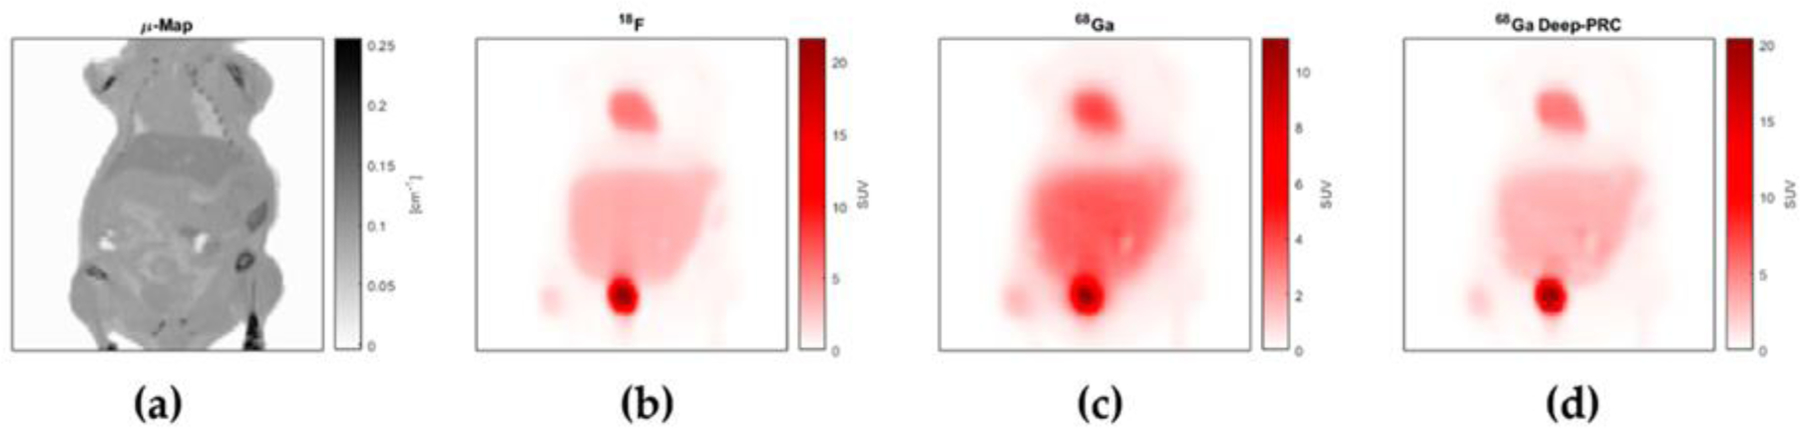
Coronal section through a simulated mouse CT scan (a), and simulated PET images of the same slice distribution of 18F (b), 68Ga (c) and 68Ga (d) corrected for positron range using the Deep-PRC neural network. Note similarity between (b) and (d) and the difference between the uncorrected 68Ga image (c). Adapted with permission from “Deep-learning based positron range correction of PET images.”, Herraiz, Joaquín L. et al., Applied sciences 11.1 (2021): 266.