
Figure 21.
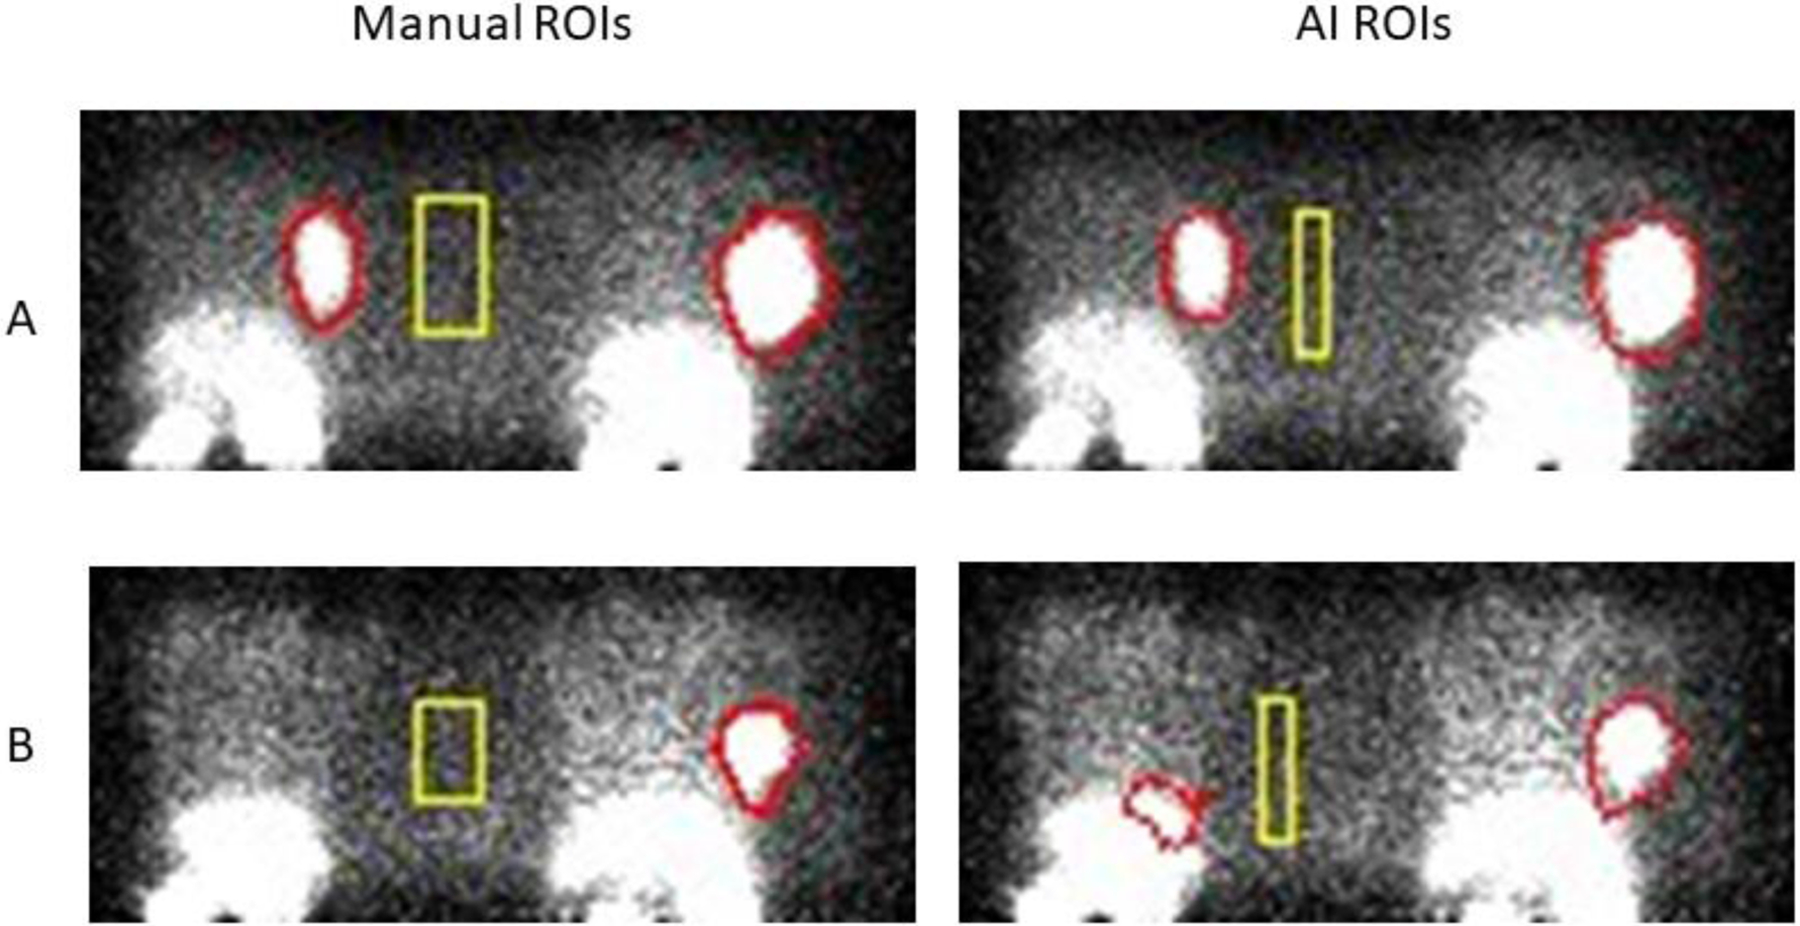
PPI images of two different mouse pairs (A and B) imaged in the geometry shown in Figure 20 where regions of interest (ROIs) have been defined manually (left panels) and by the U-net AI algorithm (right panels). Most of these test studies showed good agreement (as in A) but occasionally disagreed on the size of a background region (rectangle) and/or tumor boundaries (there was no lesion in the mouse at the left in B). Total tumor activity is relatively insensitive to the size of the background ROI but does depend on location between animals. Mean background values in the ROIs shown were not significantly different between methods. (Courtesy of K. Ma, S. Harmon, NCI/NIH)