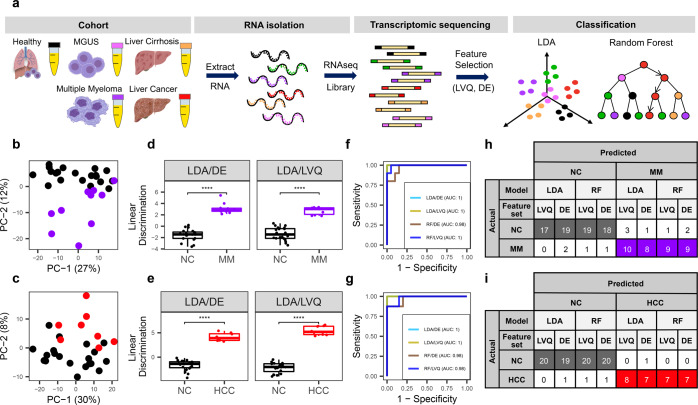
Fig. 1. cfRNA profiles distinguish between cancer vs. healthy donors.
a Schematic overview of the cfRNA profiling workflow starting from plasma collected from the patients and NC donors in EDTA-coated tubes, cfRNA extraction, sequencing, feature selection, and classification. b, c PCA analysis using the top 500 genes with the largest variance across NC and MM (b) or HCC samples (c). d, e Linear discriminant analysis (LDA) using DE genes with padj <0.01 and top ten most important genes identified by LVQ analysis. P value is derived from the Wilcoxon test. Center-line indicates the median value across all patients in that group, and the hinges represent the lower (Q1) and upper (Q3) quartile, with whiskers extending to the minimum and maximum of the resulting distribution. f, g ROC curves of the two classification models LDA and Random Forest (RF) model with two feature sets DE and LVQ. h, i LOOCV with the two models LDA and RF with two feature set DE and LVQ. DE genes are listed in Supplementary Table 3 and LVQ genes are listed in Supplementary Table 5.

